How to Reduce CAC: Creative Testing and Funnel Optimization
Jump to a section
- Why CAC Keeps Rising and What Actually Moves It
- Measuring CAC by Cohort to Find Hidden Waste
- Scaling Creative Testing Velocity to Lower Acquisition Costs
- Automating Ad Variation Production with Modular Workflows
- Fixing Funnel Leaks That Inflate CAC Despite Good Creative
- Building a Sustainable CAC Reduction Experimentation Cadence
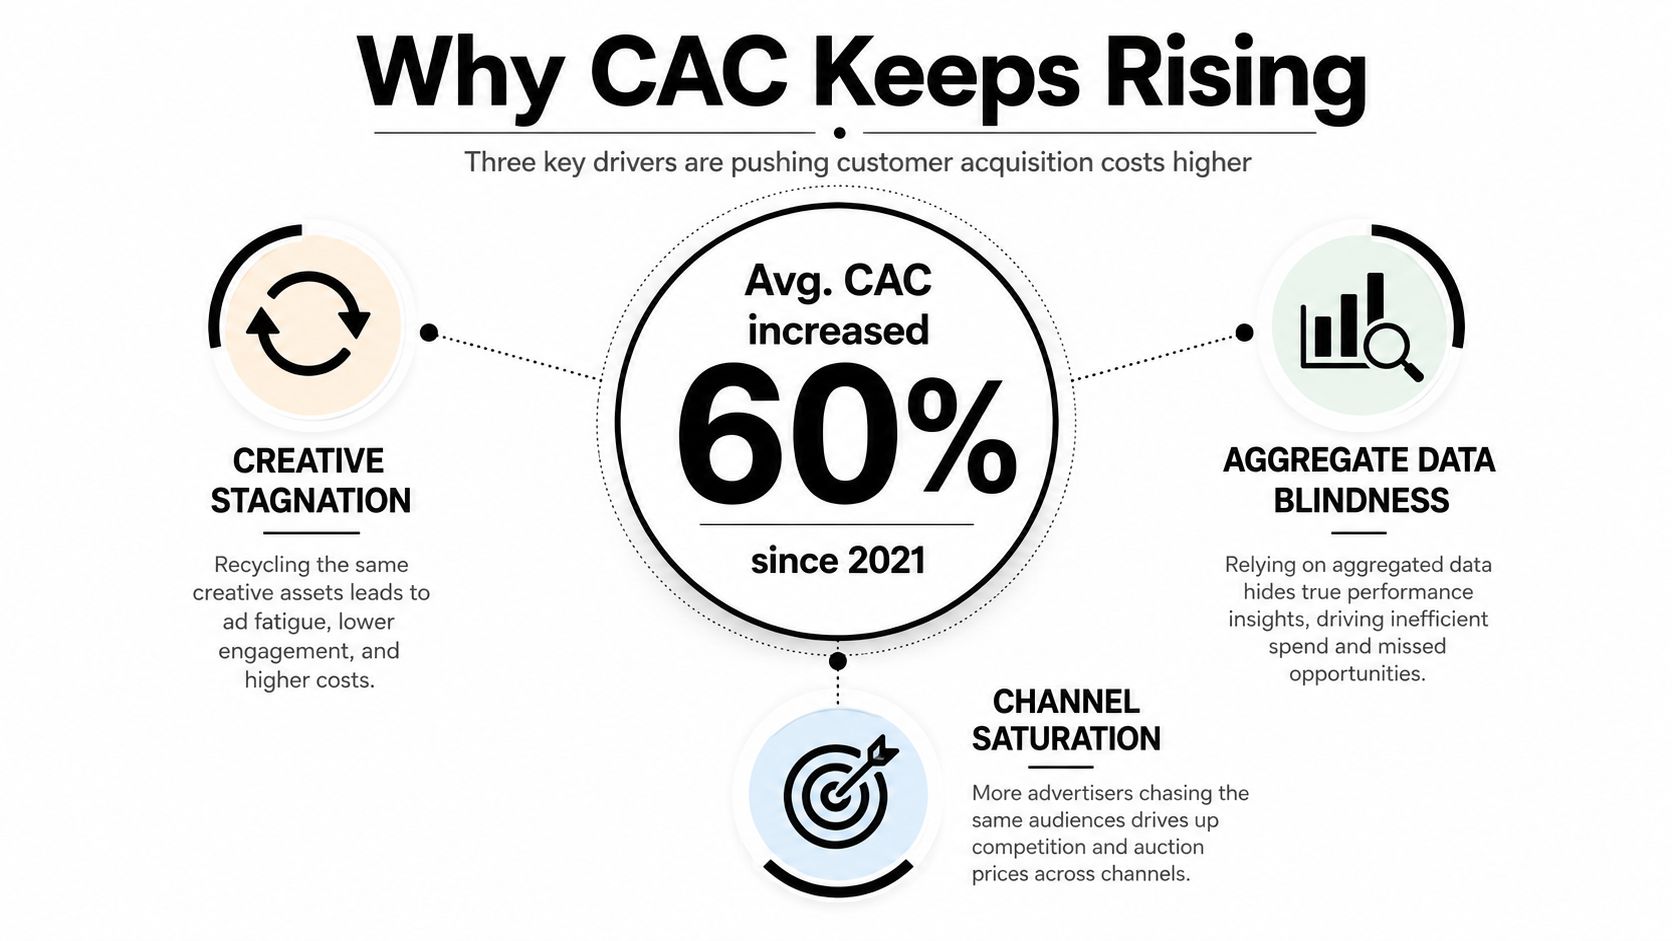
Customer acquisition cost has become materially harder to control. Widely cited benchmarking summaries put average industry CAC at about $395, up 60% over the past five years and 222% over the past eight years (benchmarking summary). The answer isn't merely to cut spend. Teams reduce CAC by finding expensive cohorts, producing better creative faster, and removing conversion friction after the click.
Why CAC Keeps Rising and What Actually Moves It
CAC equals total sales and marketing spend divided by new customers. Spend $100,000 to acquire 250 customers, and CAC is $400. Reduce spend to $80,000 while holding customer volume steady, and CAC falls to $320, a 20% reduction (CAC calculation and channel benchmarks). The calculation shows why efficiency matters, while also exposing the weakness of treating CAC as a simple budget problem.
Cutting spend can raise CAC if it removes campaigns that create qualified demand. Referral marketing is often cited at $15 to $50 per customer, organic search at $70 to $120, paid search at $200 to $350, and paid social at $150 to $300. Those gaps make channel mix relevant, yet moving budget from paid social to search does not automatically improve blended CAC. Attribution may shift while the underlying conversion problem remains.
The three levers that matter
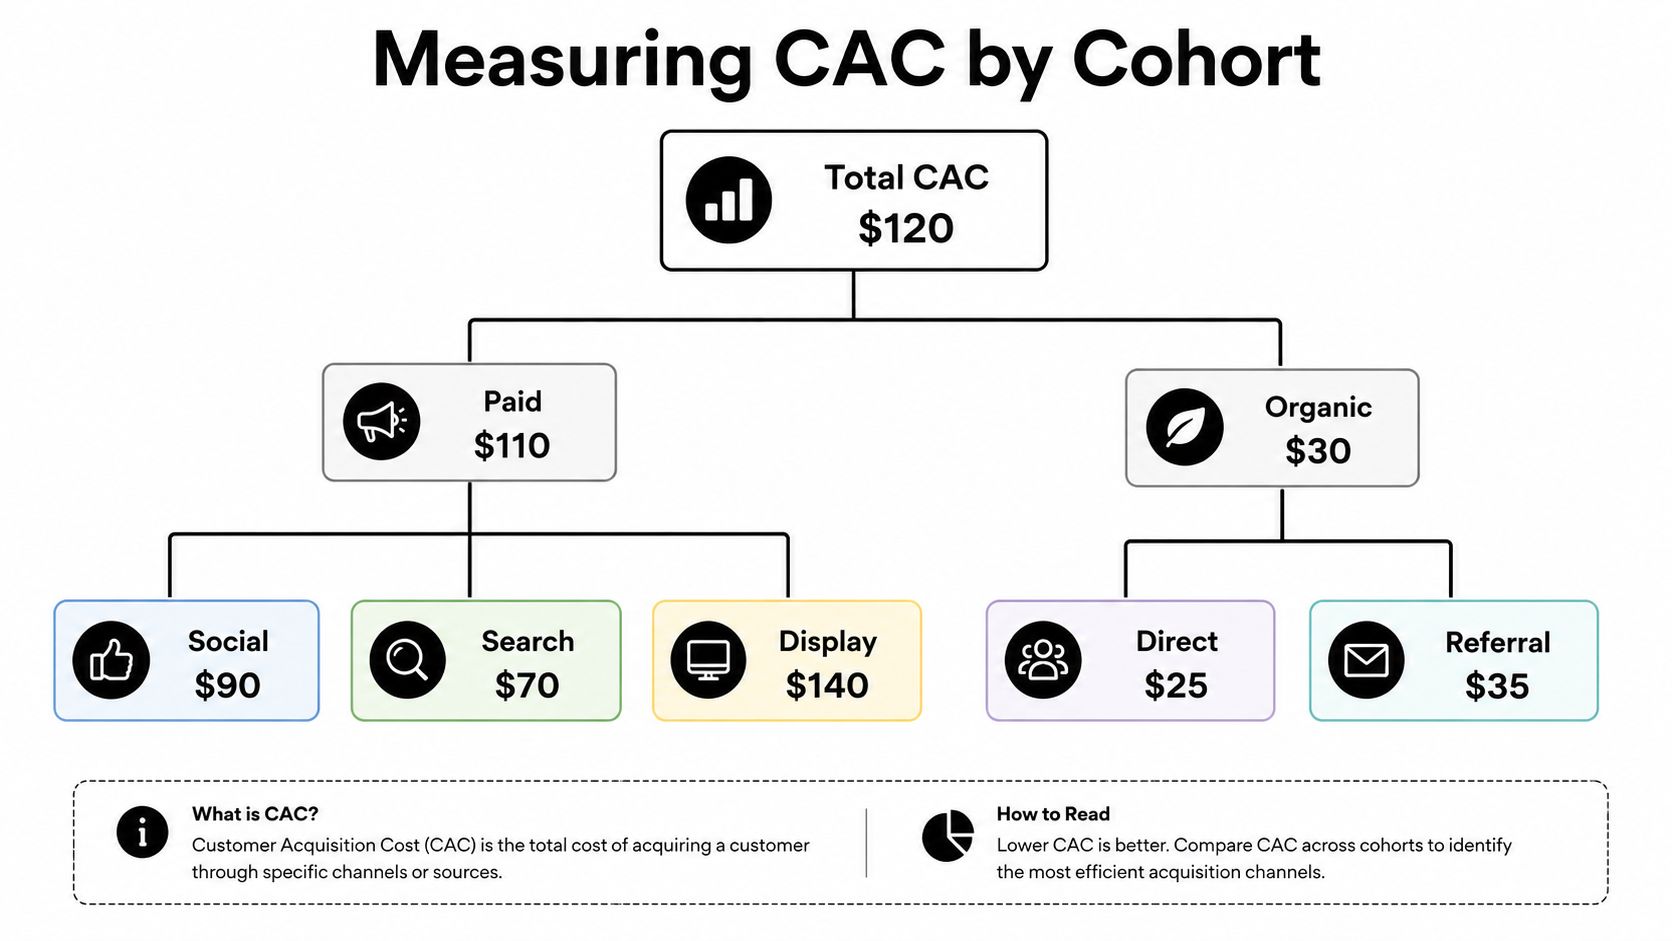
Cohort-level measurement exposes waste that blended CAC hides. A strong organic segment can subsidize an expensive paid cohort, making the account look healthy while certain audiences, offers, or campaigns consume budget without producing acceptable customers.
Creative-testing velocity keeps Meta and TikTok from depending on fatigued ads. Bid changes can improve delivery, but they cannot repair a message that no longer earns attention or a concept that attracts clicks without qualified intent. Faster testing creates more opportunities to find a winning angle before performance decays.
Funnel conversion efficiency determines how much value survives after the click. A relevant ad can still produce poor CAC when the landing page changes the promise, hides the offer, or asks for too much information before establishing trust.
Practical rule: Do not ask which channel has the lowest CAC until you know which cohorts produce customers with acceptable lifetime value.
Generic advice such as “add SEO,” “optimize bids,” or “improve targeting” leaves the main decisions unresolved. Use budget allocation methods to structure investment choices, then test the result against segmented CAC, predicted LTV, and conversion quality. Stronger unit economics come from one operating system: cohort measurement identifies waste, rapid creative testing improves acquisition efficiency, and funnel work protects the value generated after the click.
Measuring CAC by Cohort to Find Hidden Waste
A blended CAC is useful as a company-level health check, but it's too blunt for budget decisions. Calculate blended CAC using total acquisition-related costs and all new customers, then calculate paid CAC using paid media and the customers attributed to paid acquisition. Neither number should replace the other.
Build a fully loaded view
Choose a consistent quarterly window and include the costs that make acquisition possible. That means media spend, salaries, software, agency fees, production, and content costs, rather than only the invoice from Meta or TikTok. A narrow calculation may look efficient because it leaves out the people and systems supporting the campaigns.
Then divide the result across meaningful dimensions:
- Channel: Separate paid social, paid search, referral, organic search, and other acquisition paths.
- Campaign: Compare prospecting, retargeting, creative concepts, and offers instead of combining them.
- Customer segment: Separate buyer intent, product tier, geography, use case, or sales motion where the data supports it.
- Time period: Use consistent windows so seasonal demand and delayed conversions don't create false comparisons.
The cohort should represent new customers, not renewals or expansions. Blending existing-customer revenue into new-customer counts makes acquisition appear cheaper without proving that new demand became more efficient.
Compare cost with future value
A cohort with a low CAC can still be a poor investment if customers churn quickly or buy a low-margin product. Compare CAC with predicted LTV at the same cohort level, and watch whether one channel is subsidizing another in the blended total.
A commonly used sustainable-growth benchmark is an LTV:CAC ratio of at least 3:1, while SaaS teams often use CAC payback under 12 months as a practical discipline (CAC measurement benchmarks). Historical SaaS benchmarks also report a median New CAC Ratio of 2.00 in 2024 and fourth-quartile companies spending $2 to acquire $1 of new ARR, which illustrates how acquisition inefficiency can persist even while revenue grows (SaaS acquisition efficiency benchmarks).
Use a sample size calculator for marketing experiments before acting on a small cohort. Scale segments that combine acceptable acquisition cost, conversion quality, and predicted value. Cut or redesign segments where the numbers remain weak after checking attribution and sales follow-up.
Scaling Creative Testing Velocity to Lower Acquisition Costs
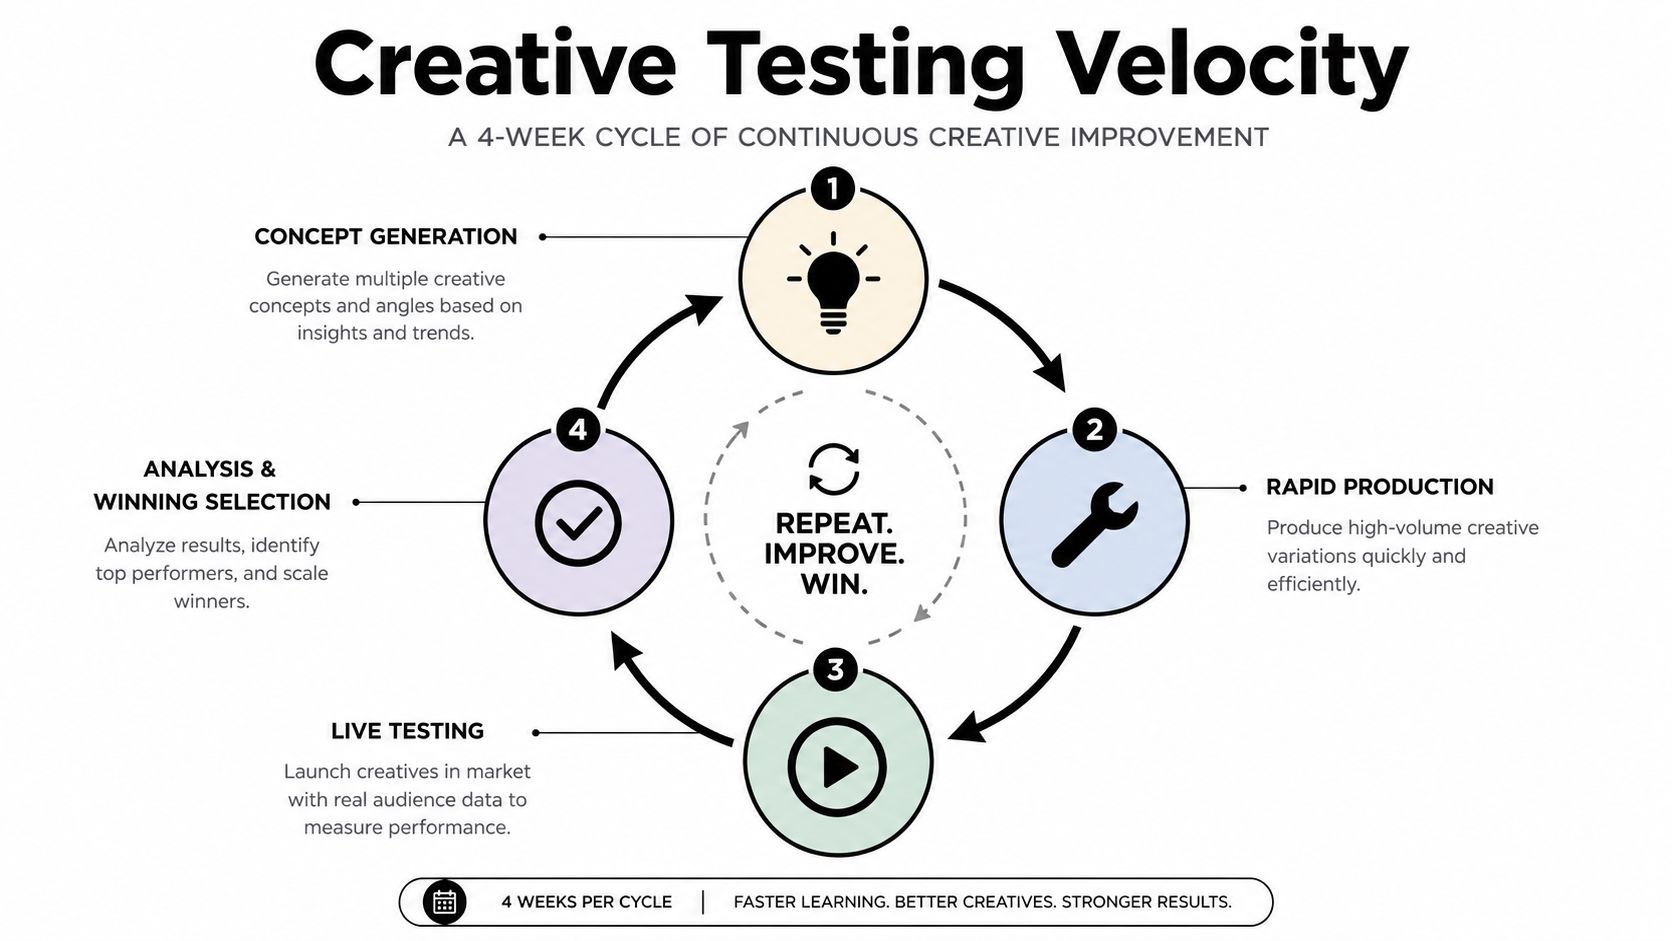
Creative fatigue is a throughput problem before it becomes a design problem. If an account repeats the same promise, opening shot, creator format, and proof point, buyers eventually pay more to reach people who have already ignored the message. Faster testing creates more chances to find a stronger angle before declining efficiency spreads across the campaign.
Independent guidance recommends testing 15 to 30 distinct creative concepts per week for every $100,000 in spend, while reserving 20% to 30% of budget for a dedicated testing sandbox. The same creative velocity benchmark associates that operating intensity with a 15% to 30% CAC reduction within 4 to 8 weeks. Treat these figures as planning references, not promises. Concept quality, audience fit, offer strength, and measurement determine whether added volume produces useful winners.
Design a real testing sandbox
Feed the sandbox new concepts weekly and isolate one major variable at a time. Test the hook, proof mechanism, offer, creator, visual structure, or call to action, rather than changing everything in one execution. Clean isolation helps the team understand why a variation worked and makes the result easier to apply elsewhere.
Minor reskins do not count. A different background color or logo position creates a new file, not a new strategic hypothesis. A distinct concept changes the reason someone should care, the product story, or the evidence supporting the promise.
Make production serve learning
A practical weekly cycle looks like this:
- Generate concepts from customer objections, sales calls, comments, search language, and historical winners.
- Produce quickly with reusable footage, multiple hooks, and format-specific edits.
- Test cleanly using consistent naming, controlled variables, and a defined success event.
- Promote winners into the main campaign while sending fresh variations back to the sandbox.
Landing-page adjustments should not replace creative testing. Bid strategies can improve efficiency at the margin, while a stronger concept can improve the quality and quantity of attention available to the account. Use this Meta Ads creative testing framework to document hypotheses and keep media buyers, strategists, and editors aligned.
Keep the cycle running while performance is healthy. Strong ads eventually fatigue, and pausing experimentation then leaves the account without replacement candidates when efficiency falls.
Automating Ad Variation Production with Modular Workflows
High creative velocity becomes difficult when every ad requires a fresh brief, shoot, edit, review, export, and upload. The solution isn't to publish random variations. It's to build a modular system where existing assets can be recombined around clear hypotheses.
Start by separating footage into reusable components:
- Hooks: Opening lines, visual interruptions, questions, or problem statements.
- Bodies: Demonstrations, product explanations, testimonials, comparisons, and objections.
- Proof: Product screens, reviews, outcomes, demonstrations, or trust elements.
- Calls to action: Direct response language matched to the funnel stage.
- Formats: Crops, aspect ratios, captions, overlays, and platform-specific edits.
An AI-powered asset management layer can detect scenes and transcripts, then organize clips into a searchable asset bank. That changes the creative team's starting point. Instead of asking an editor to find “the clip where the founder explains setup,” a strategist can search the footage library by scene, transcript, or tag and assemble a new sequence from known material.
Build controlled variation, not content noise
The workflow should preserve the variables that matter. Keep the offer and destination stable while testing different hooks, or keep the hook stable while comparing proof structures. Bulk text overlays, format adaptation, caption changes, voiceovers, and B-roll swaps can expand the test matrix without requiring a new shoot for every idea.
Direct publishing into Ads Manager also reduces handoff delays, but speed doesn't replace governance. Use naming conventions, version ownership, approval permissions, and a record of the hypothesis behind each variation. Otherwise, the team produces more files while losing the ability to connect performance back to a creative decision.
Modular video ad frameworks help define the relationships between these components before production begins. Sovran is one option that combines AI-assisted asset organization, modular video assembly, bulk overlays, format adaptation, timeline editing, collaboration controls, and direct Meta publishing for teams that need to turn existing footage into structured testing batches. The important principle is broader than any one platform: production should make learning faster, not merely make the asset folder larger.
Fixing Funnel Leaks That Inflate CAC Despite Good Creative
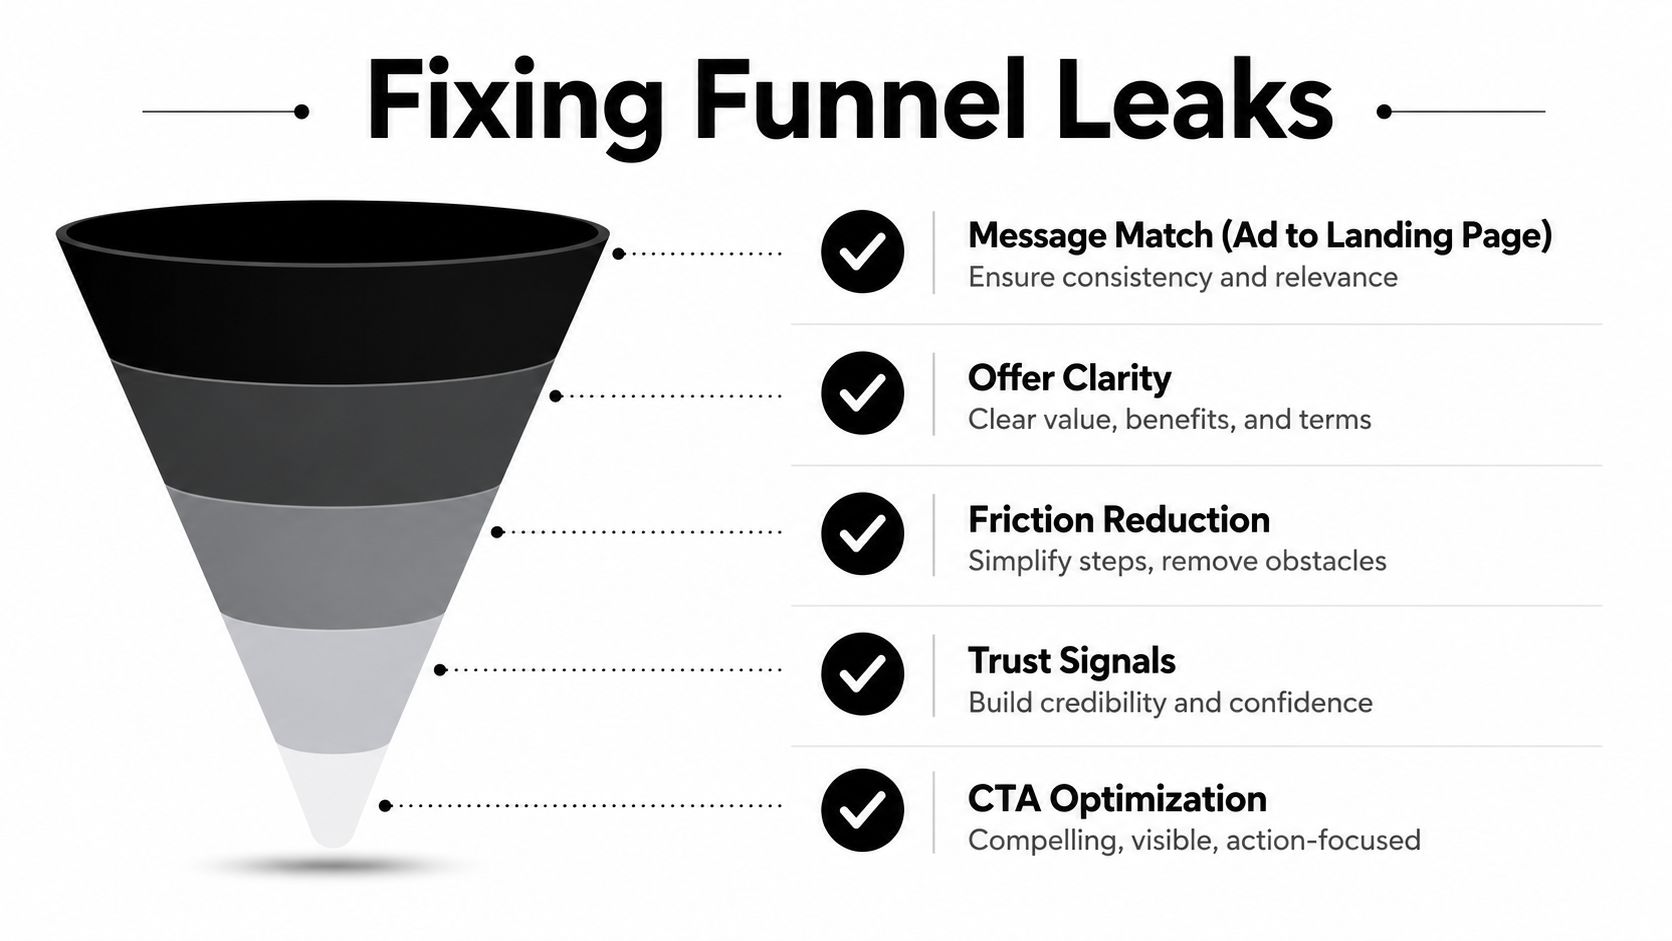
A strong ad can create qualified intent and still produce poor CAC if the destination fails to carry that intent forward. The most common leak is message mismatch. The ad promises a specific outcome, but the landing page opens with a generic headline, a different offer, or a form that demands commitment before explaining value.
Audit the path, not just the page
Review the journey from impression to customer by traffic source and campaign. Look for the first point where qualified users stop progressing:
- Message match: Repeat the ad's central promise immediately on the landing page.
- Offer clarity: Explain what the buyer gets, who it's for, and what action comes next.
- Friction reduction: Remove unnecessary fields, confusing navigation, and premature requests for information.
- Trust signals: Place relevant proof near the decision point, not buried below unrelated copy.
- CTA optimization: Use a clear action that reflects the user's level of intent.
A page can have an acceptable overall conversion rate while hiding a serious paid-social problem. Segment the data by source, campaign, device, landing-page version, and funnel stage. If paid social users click but abandon before the form, the destination may be misaligned. If they complete the form but fail to become customers, the issue may sit in qualification, sales follow-up, pricing, or onboarding.
Test the whole chain
Don't celebrate a higher click-through rate if qualified conversion falls. Track the movement from impression to click, click to lead or signup, signup to qualified opportunity, and opportunity to customer. The useful question is whether the change reduces fully loaded CAC for a healthy cohort, not whether one intermediate metric improved.
Use CTA guidance for video ads to keep the ad's action consistent with the destination experience. A direct purchase ad shouldn't send users to an educational page with no clear buying path, and a problem-aware ad shouldn't force a high-commitment form before giving the visitor enough context.
Building a Sustainable CAC Reduction Experimentation Cadence
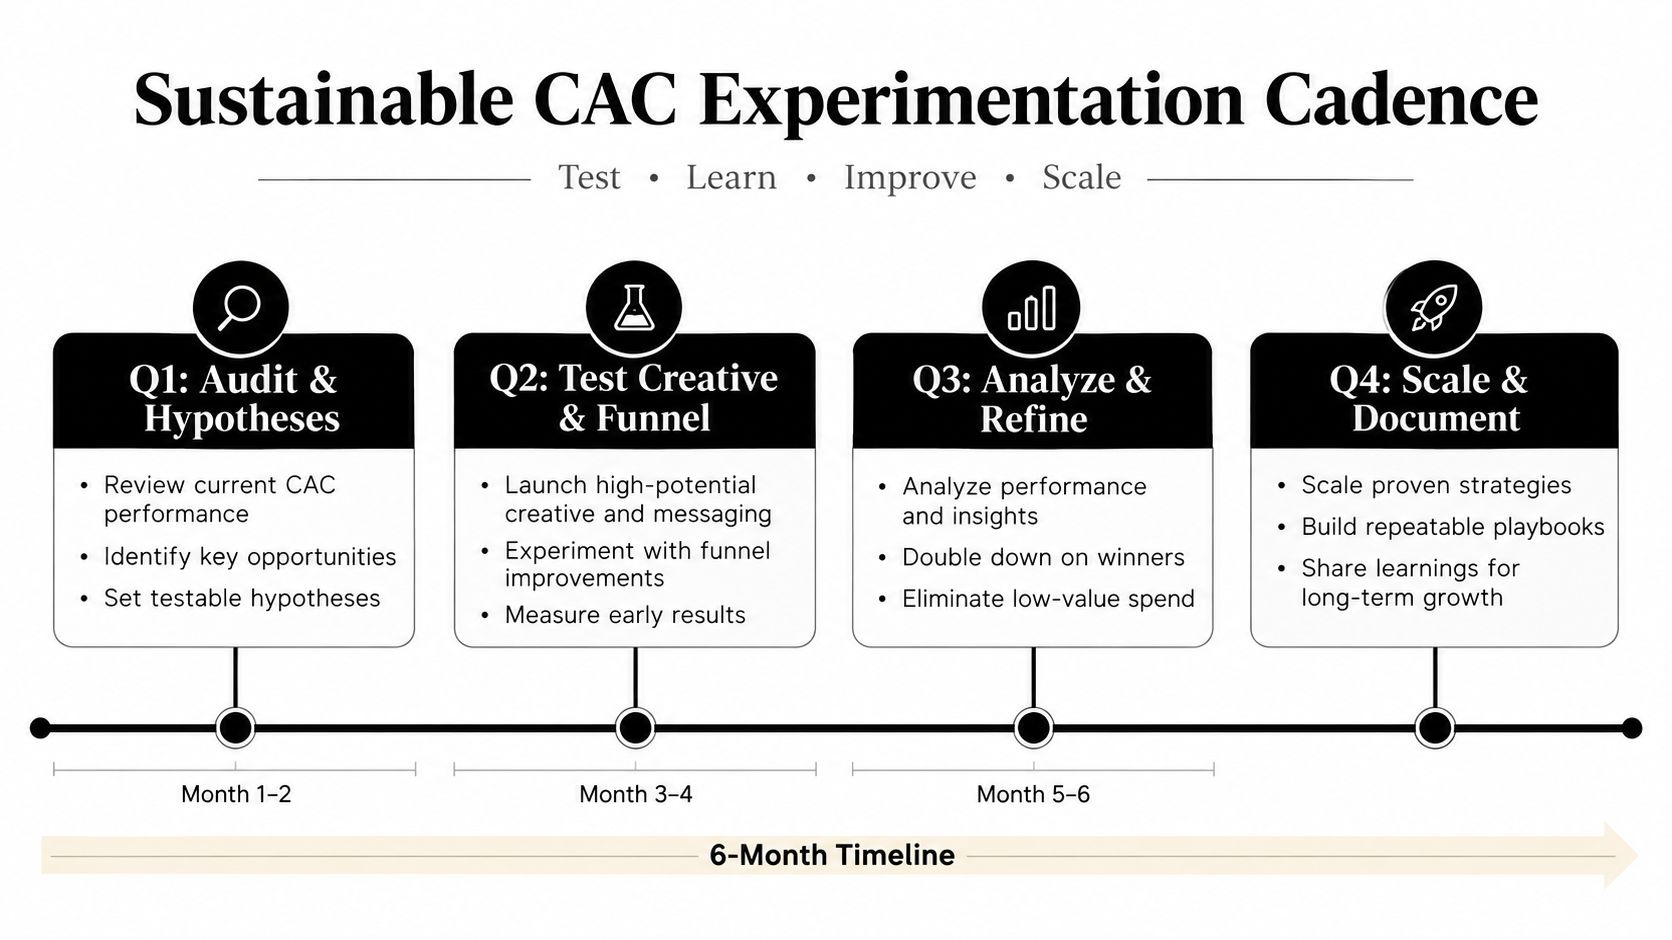
CAC reduction works best as an operating cadence, not a rescue project launched after performance deteriorates. Assign each quarter a small set of cohort-level targets and hypotheses, then connect media buying, creative production, landing-page work, and customer feedback to the same measurement view.
Use a recurring review rhythm
At the start of a planning cycle, audit fully loaded CAC by channel, campaign, segment, and time period. Identify expensive cohorts, verify the customer definition, check predicted LTV, and write hypotheses that explain the likely waste.
During execution, maintain the creative pipeline while testing funnel changes deliberately. A media buyer should know which concepts are entering the sandbox, a creative strategist should know which objections appear in the cohort data, and a product marketer should understand where the landing page or onboarding experience loses qualified demand.
Track more than aggregate CAC:
- Paid CAC and blended CAC, kept separate.
- CAC by cohort, including channel, campaign, segment, and period.
- Conversion rate at each funnel stage, not only the final customer event.
- Predicted LTV and LTV:CAC, evaluated against the same cohort.
- CAC payback, especially for recurring-revenue businesses.
- Creative replacement rate, showing whether the testing pipeline can supply new concepts.
- Quality signals, such as qualification, activation, retention, or purchase behavior.
Don't declare a win based on a short fluctuation. Check whether the result persists across a consistent measurement window and whether the new customers behave like the customers the business wants. A cheap cohort that needs heavy support or fails to retain can worsen economics even when the dashboard reports a lower acquisition cost.
The best CAC program makes budget decisions easier because every test has a cohort, a hypothesis, and a defined economic outcome.
Keep testing during strong performance. Creative fatigue returns, platform delivery changes, and yesterday's winning angle eventually becomes familiar. A durable program documents winning concepts, failed hypotheses, production inputs, funnel changes, and the conditions under which each result occurred.
Sovran can help performance teams turn existing footage into modular ad variations, organize assets with AI-assisted tagging, and move structured batches into Meta workflows. Visit Sovran to see how its creative testing platform can support a faster production cadence while your team measures the resulting CAC by cohort.

Manson Chen
Founder, Sovran
Related Articles

8 Pattern Interrupt Techniques for Video Ads
Customer Journey Mapping for Performance Marketing