How to Calculate Sample Size for A/B Tests
Jump to a section
You launch a new ad on Meta or TikTok, check results the next morning, and the new creative looks better. CTR is up. CPC looks cleaner. The control suddenly feels old and expensive.
That's the moment most bad testing decisions happen.
The problem isn't that marketers move fast. The problem is that platforms generate noisy early data, and noisy early data can look convincing. If you don't know how to calculate sample size before you launch, you're not really running a test. You're reacting to variance.
A good sample size target gives you a stop rule. It tells you how much data each variation needs before you trust the result. That matters whether you're judging a hook on CTR, a landing page on CVR, or a new funnel on AOV. It also matters when budget is tight and you can't afford to let every test drag on forever.
Why Guessing Your Sample Size Is Costing You Money
A media buyer launches a fresh video ad against a stable control. Early results favor the challenger. The instinct is obvious. Pause the loser, shift budget, and move on.
Sometimes that works. Often it doesn't.
The two expensive mistakes
When sample size is too small, you usually fall into one of two traps:
- False positive: You scale a creative that looked strong early but wasn't better.
- False negative: You kill a creative that had real upside, but the first wave of data didn't show it.
Both errors hurt ROAS in different ways. A false positive burns spend because you back the wrong ad. A false negative slows growth because you keep feeding budget to the old control while the more effective ad never gets enough runway.
Practical rule: Early lifts are signals, not decisions.
This gets worse on short review cycles. Teams often evaluate creative after a day because they need speed, budget control, and fresh assets in market. But ad platform delivery isn't perfectly even, audiences aren't identical from hour to hour, and creative performance can wobble hard at the start. One ad can look amazing because it got a favorable pocket of inventory or a lucky first set of users.
Why this is a business discipline, not a stats exercise
Sample size isn't academic overhead. It's protection against bad budget allocation.
If you're testing hooks, thumbnails, UGC intros, or offer framing, the cost of acting on weak data compounds fast. You don't just lose one test. You train your team to trust unstable signals. Over time, that leads to churn in your ad account, random creative decisions, and a testing backlog full of inconclusive outcomes.
It also affects how many creatives you should run at once. If you split spend across too many variants, none of them gets enough data to produce a trustworthy read. That's why test design and variation count have to work together. This guide on how many ad variations to test is useful if you're spreading budget too thin.
What a better process looks like
Strong testing teams decide upfront:
- What metric matters most
- What lift is worth caring about
- How much error risk they'll tolerate
- How much data each version needs before anyone calls a winner
That's the practical foundation of sample size. Without it, every green number in Ads Manager looks more certain than it really is.
The Four Levers That Control Your Sample Size
Before you open a calculator, define the inputs. Most confusion around how to calculate sample size comes from skipping this step and jumping straight to the formula.
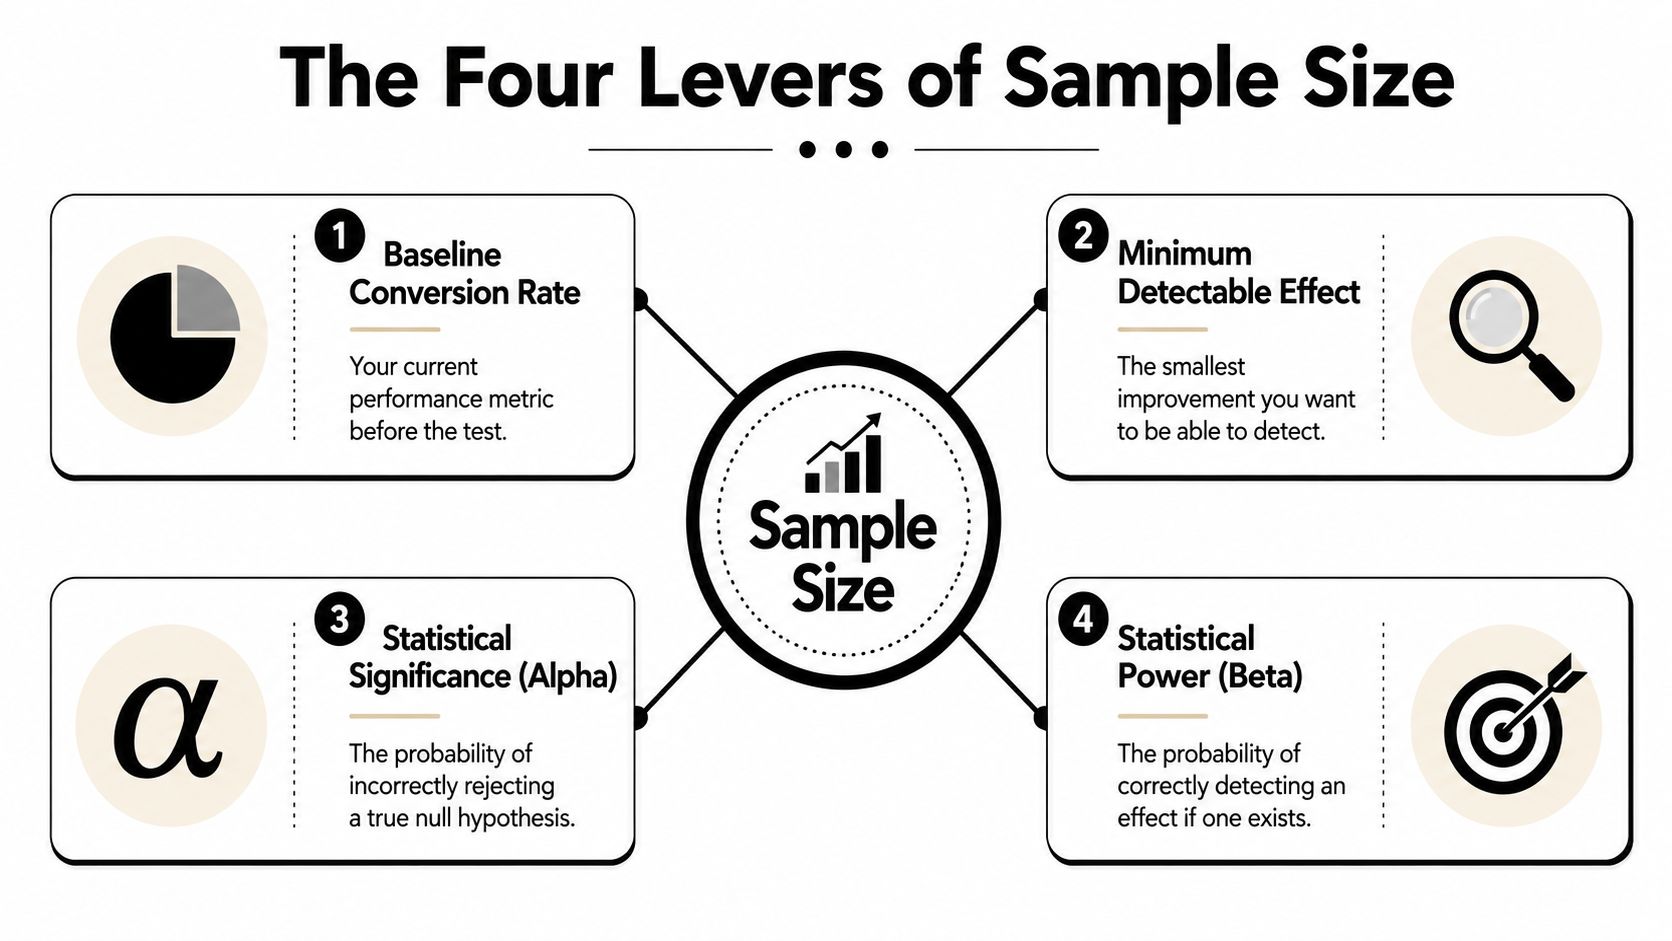
Baseline rate
This is your current performance level before the test. For creative tests, that's often CTR. For landing page tests, it might be CVR. For purchase flow tests, it could be a deeper conversion rate.
If your baseline is shaky, your sample size estimate will be shaky too. Don't pull baseline performance from a weird day, a holiday spike, or one ad set with unusual audience quality. Use a stable recent benchmark from comparable traffic.
A few examples of baseline questions:
- Creative test on Meta: What CTR is the current control getting?
- UGC angle test on TikTok: What's the current thumb-stop or click rate on similar spend?
- Landing page test: What share of clicks currently convert?
If you're actively trying to improve click-through rates, your baseline CTR is the anchor for deciding how much traffic the next test needs.
Minimum detectable effect
This is the smallest lift that would matter to the business. Not the smallest lift you'd be happy to see in a report. The smallest lift worth acting on.
If a new creative beats control by such a tiny amount that it doesn't change budget allocation, creative direction, or margin, then it's not the effect you should design your test around.
Think of minimum detectable effect, or MDE, as your “is this worth it?” threshold.
- A tiny MDE means you want to detect subtle differences. That requires more data.
- A larger MDE means you only care about clear winners. That reduces the required sample size.
If budget is tight, chasing tiny lifts is usually the first thing to cut.
Statistical significance
This is your tolerance for a false positive. In plain English, how careful do you want to be before declaring a winner?
A stricter threshold lowers the chance that you scale a fake winner, but it also increases the sample size you need. That's the trade-off. More certainty costs more time and media.
For performance marketers, this isn't about sounding rigorous in a slide deck. It's about matching the test to the decision. If the outcome will drive major budget shifts, use a stricter standard. If it's an early directional creative screen, teams sometimes accept more risk to move faster.
Statistical power
Power protects you against missing a real winner. It answers a different question than significance.
Significance says, “How hard should it be to call something a win?”
Power says, “How likely am I to catch a real win if it exists?”
Low power creates a graveyard of discarded ads that might have worked. That's common when teams launch too many variants at once, starve each one of impressions, and then mark most tests as “no difference.”
A quick marketer's view
Here's the simplest way to think about the four levers:
| Lever | What it means in practice | If you tighten it |
|---|---|---|
| Baseline rate | Your current CTR, CVR, or similar metric | Sample size changes based on starting point |
| MDE | The smallest lift worth shipping | Smaller target lift means more data |
| Significance | Protection against false winners | More caution means more data |
| Power | Protection against missed winners | More protection means more data |
It's not usually a math problem. It's a decision problem. Once these four inputs are clear, the calculation becomes straightforward.
Calculating Sample Size for Proportions (CTR and CVR)
Most ad tests deal with proportions. Did a user click or not? Convert or not? Subscribe or not? CTR and CVR both live in this category, which means the same testing logic usually applies.
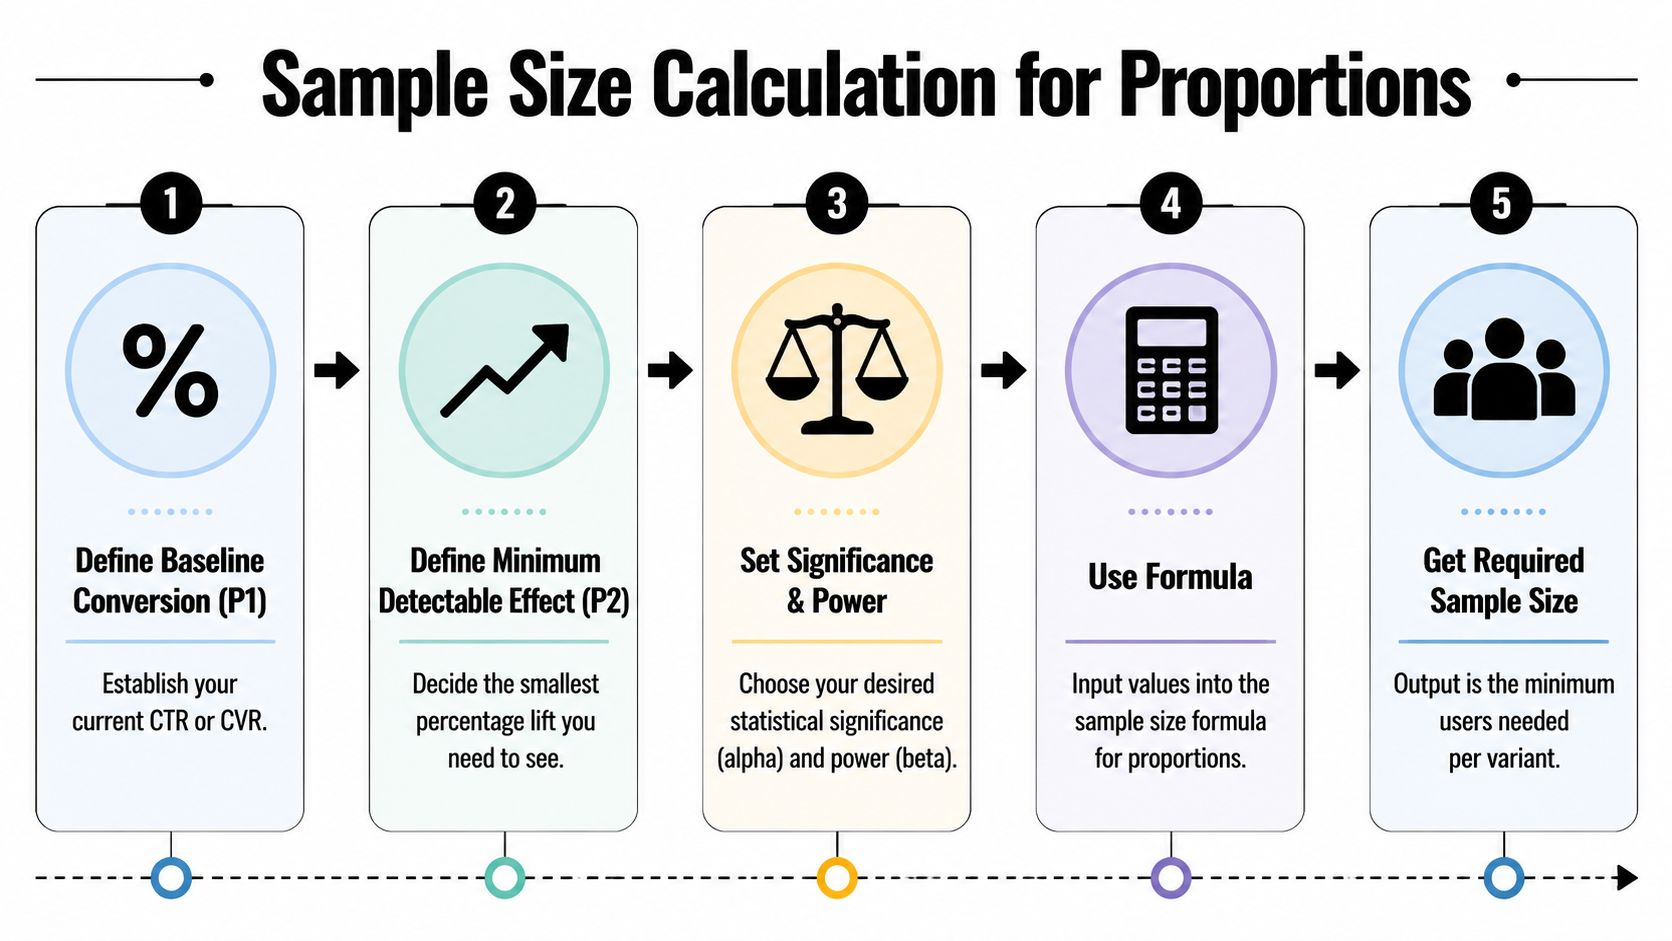
A practical way to calculate sample size for proportions is to compare two rates: the control rate and the challenger rate you'd need to see to justify a change.
A standard formula for a two-variant test looks like this:
n per variant = 2 × (Zα/2 + Zβ)² × p̄ × (1 − p̄) / (p1 − p2)²
Where:
- p1 is the baseline rate
- p2 is the rate you want to be able to detect
- p̄ is the average of p1 and p2
- Zα/2 reflects your significance threshold
- Zβ reflects your desired power
That formula matters, but most media buyers don't need to calculate it by hand every time. You need to know what goes into it and what changes the answer.
Here's a visual version of the process.
Worked example with CTR
Say your control ad has a 1.5% CTR. You've decided a new creative only matters if it can beat that by at least 10% relative lift. That puts your target detectable CTR at 1.65%.
You also choose standard test settings:
- Significance: 95%
- Power: 80%
Now plug in the values:
- p1 = 0.015
- p2 = 0.0165
- p̄ = (0.015 + 0.0165) / 2 = 0.01575
- For common settings, Zα/2 ≈ 1.96
- And Zβ ≈ 0.84
Using the formula:
- Add the Z values: 1.96 + 0.84 = 2.80
- Square that result: 2.80² = 7.84
- Calculate p̄ × (1 − p̄): 0.01575 × 0.98425 ≈ 0.0155
- Find the absolute difference between rates: 0.0165 − 0.015 = 0.0015
- Square the difference: 0.0015² = 0.00000225
- Multiply the numerator: 2 × 7.84 × 0.0155 ≈ 0.243
- Divide by the squared difference: 0.243 / 0.00000225 ≈ 108,000
That gives you about 108,000 impressions per variant.
This is why so many creative tests feel inconclusive. CTR differences that matter to a business can still be small in absolute terms, and small absolute differences require a lot of traffic.
A “big” relative lift can still be a tiny absolute change. Sample size responds to the absolute gap.
For marketers who prefer to sanity check the math in a browser, use an A/B test sample size calculator and enter the same baseline, target lift, significance, and power.
Why marketers underestimate required traffic
Creative teams often think in relative lifts because that's how results are presented in dashboards. A new hook might look meaningfully better in percentage terms. But the calculator cares about the actual distance between rates.
That's why low-baseline metrics can need a surprising amount of traffic. Detecting movement from a low CTR or low CVR takes patience.
This matters operationally:
- Top-of-funnel CTR tests often need a lot of impressions.
- Purchase CVR tests can need fewer clicks than impressions, but high-intent events may still take time because conversions are sparse.
- ROAS tests are even slower because revenue adds extra noise.
A short explanation on the decision mindset is worth watching before you set up your next test.
When to trust the result
Don't trust a CTR winner because it's green in-platform. Trust it when the test reaches the planned sample size and the read still holds.
That discipline is part of why data-driven teams make better calls. A PwC study on data-driven decision-making found that businesses that embrace data-driven decision-making are three times more likely to report significant improvements in their decision-making processes.
If your team runs lots of creative tests, this isn't theory. It's workflow hygiene.
Calculating Sample Size for Averages (ARPU and AOV)
Not every test is a yes-or-no event. Sometimes the outcome is a continuous number, like average order value, average revenue per user, or even average watch time.
That changes the sample size setup. Instead of comparing two proportions, you're comparing two means.

The extra input you need
For mean-based tests, the key extra ingredient is standard deviation. In practical terms, this is just a measure of spread.
If most orders cluster close to the average, spread is low. If some customers buy small orders and a few buy very large orders, spread is high. Higher spread means more noise, and more noise means you need more conversions before you can tell whether one funnel or creative lifts value.
A common two-sample formula looks like this:
n per variant = 2 × (Zα/2 + Zβ)² × σ² / Δ²
Where:
- σ is the estimated standard deviation
- Δ is the smallest average lift worth detecting
A practical AOV setup
Suppose you're testing two ad approaches for the same product line. One is polished studio creative. The other is a rougher UGC-style ad that might pre-frame the offer better and bring in higher-intent buyers.
Your primary question isn't CTR. It's this: does the traffic from one ad produce higher average order value after conversion?
To set the sample size, pull recent order data from your store or analytics stack and estimate:
- your current average order value
- the standard deviation of order values
- the smallest lift in AOV that would justify preferring one ad over the other
If order values bounce around heavily, you'll need more completed purchases per variant. If order values are tight and consistent, you can detect a meaningful change with fewer conversions.
What usually works in practice
For ARPU and AOV tests, these habits help:
- Use recent comparable data: Estimate standard deviation from similar campaigns, not from your entire account history.
- Trim obvious anomalies carefully: One bizarre transaction can distort spread. Don't manipulate the data to force a result, but do review whether outliers reflect normal business conditions.
- Judge on conversions, not impressions: For mean-based revenue metrics, the useful sample is usually completed revenue events.
- Avoid mixing segments: AOV variance changes across geos, products, and offers. Combining unlike traffic sources can make the required sample size much larger and the result harder to interpret.
Revenue metrics are closer to the business outcome, but they're usually noisier than click metrics. That's the trade.
If you don't have enough conversion volume for a clean AOV or ARPU test, don't fake precision. Use an upstream metric for screening, then reserve deeper revenue validation for the variants that survive.
Navigating Real-World Testing Constraints
The calculator gives you an answer. Your budget gives you a different answer.
That's normal. The useful question isn't whether the ideal sample size is feasible. The useful question is how to adapt without fooling yourself.
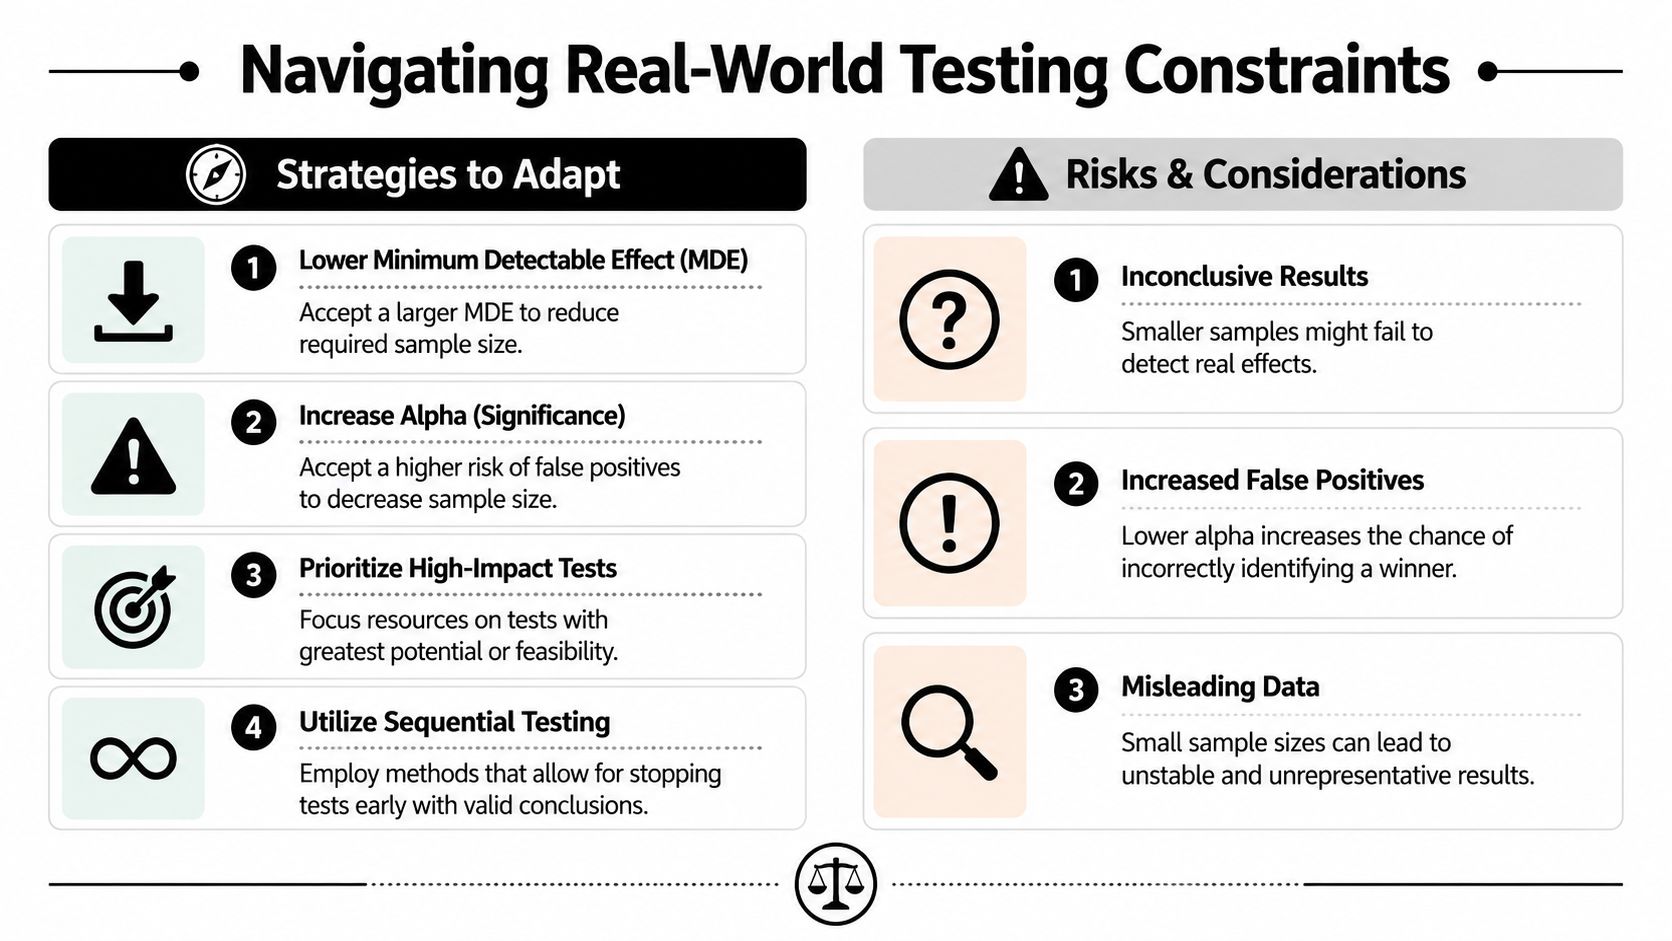
What to change first
If your required sample size is unrealistic, adjust the test design in business terms.
A practical order of operations looks like this:
Increase the MDE
If you only need to identify obvious winners, set a larger minimum detectable effect. This is often the cleanest fix because it aligns the test with decisions that matter.Reduce the number of simultaneous variants
Splitting spend across too many ads is one of the fastest ways to create weak reads. Fewer variants usually beats underfunded breadth.Use a screening funnel
Test CTR or thumb-stop first, then send shortlisted creatives into a deeper conversion or revenue test.Lower power only if the consequence is acceptable
This raises the chance you'll miss a real winner. That can be fine for low-stakes creative filtering, but it's a poor choice for major budget decisions.
What not to do
The worst workaround is to keep your original test plan on paper and then stop early because one ad looks ahead.
That's just peeking.
In a traditional fixed-horizon test, you decide the sample size in advance and wait until you hit it. If you repeatedly check the results and stop the moment they look favorable, you increase the chance of declaring a winner by luck.
Here's the practical problem: ad data wiggles. If you stare at enough interim snapshots, one of them will often tell a flattering story.
Small samples don't just create uncertainty. They create overconfidence in whichever direction the noise happens to lean.
When sequential testing makes sense
If you need flexibility, use sequential testing instead of casual peeking. Sequential methods are designed for ongoing monitoring with valid stopping rules.
That's attractive for performance teams because it can let you stop sooner when the evidence becomes strong enough, rather than waiting for a rigid endpoint every time. It's especially useful when platform costs, creative fatigue, or launch speed make long tests expensive.
But there's a condition. You need to choose a sequential framework upfront and follow its rules. “Checking every few hours and calling it when it feels clear” is not the same thing.
A workable decision framework
When constraints get messy, use this table:
| Situation | Better move | Main risk |
|---|---|---|
| Budget is limited | Test fewer variants or raise MDE | You may miss smaller but useful lifts |
| Traffic is slow | Move upstream to a higher-volume metric | The upstream winner may not win on revenue |
| Need fast answers | Use a valid sequential method | Requires discipline in setup and interpretation |
| Creative backlog is large | Prioritize highest-upside hypotheses | Some decent ideas won't get tested |
For teams building a more systematic workflow, an ad creative experimentation tool can help structure hypotheses and reduce the chaos that leads to weak tests.
The real senior-level trade-off
Senior marketers don't chase perfect textbook conditions. They make informed compromises.
The key is to make those compromises explicitly. If you reduced power, say so. If you raised the MDE because only major lifts matter, say so. If the test is directional only, label it that way and don't present it like hard proof.
That's the difference between practical testing and statistical cosplay.
Your Pre-Launch Checklist and Recommended Tools
Most testing mistakes happen before launch. Not because the team can't read data, but because nobody locked the decision rules in advance.
Use this checklist before every A/B test.
The pre-launch checklist
- Primary metric: Pick one main outcome. CTR, CVR, AOV, or ARPU. Don't switch metrics after the test starts.
- Baseline: Use a stable recent benchmark from comparable traffic.
- Meaningful lift: Define the smallest win worth acting on.
- Test settings: Set significance and power before launch.
- Traffic plan: Confirm the budget and expected delivery can realistically reach the target sample.
- Stop rule: Decide whether this is a fixed-horizon or sequential test.
- Variant count: Make sure spend isn't split so widely that every result ends up inconclusive.
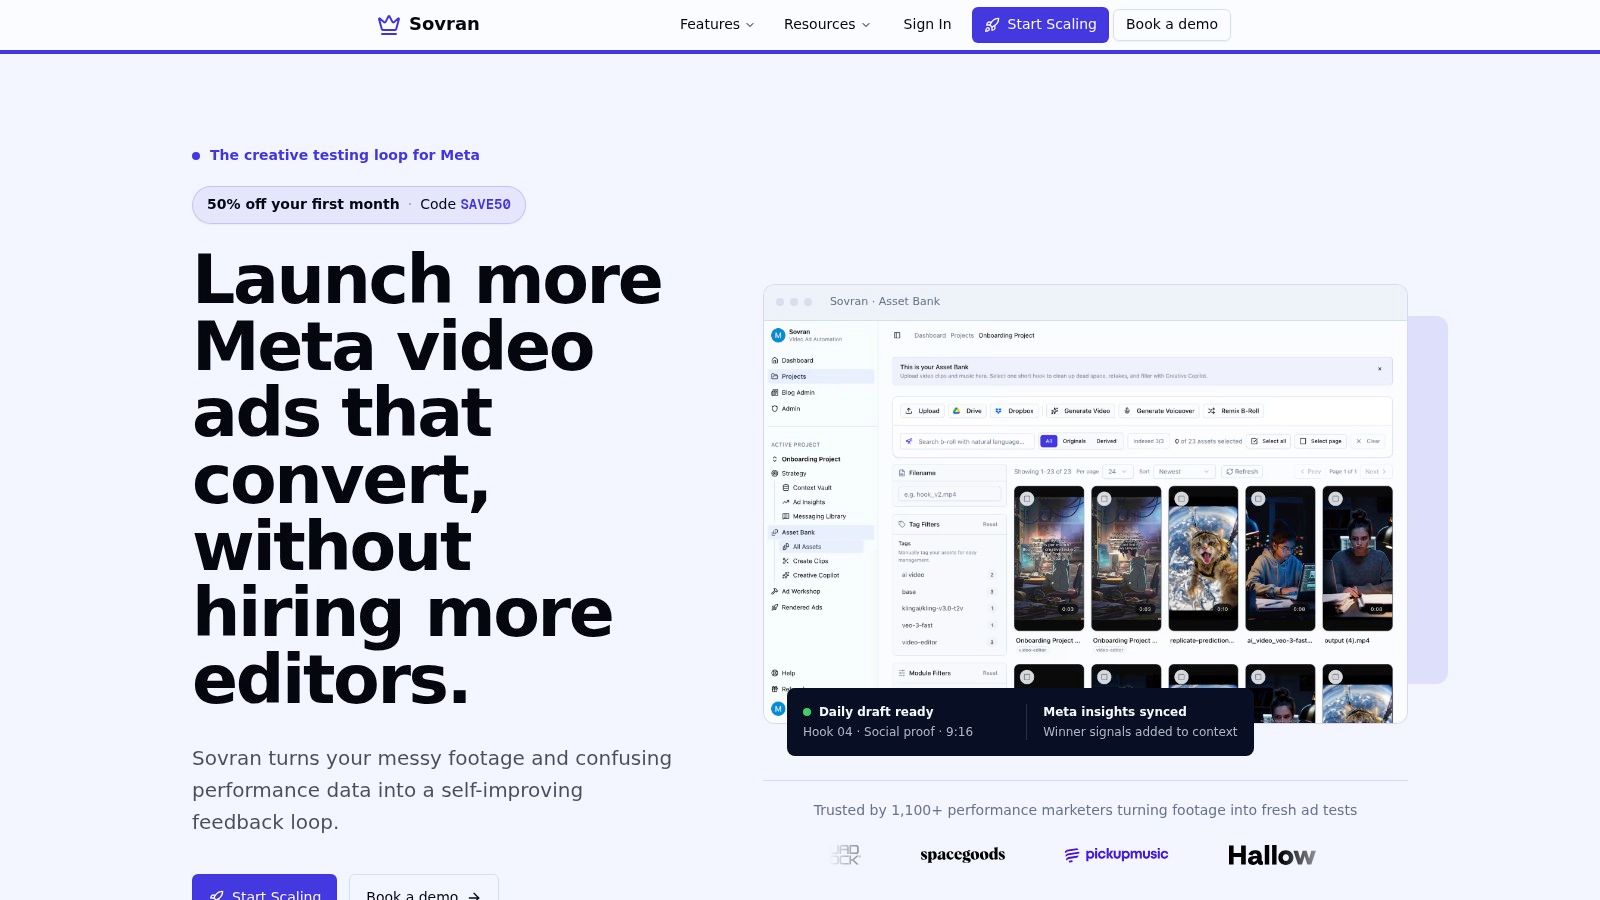
Here's the kind of high-volume testing environment many growth teams are working toward.
Tools worth bookmarking
You don't need to memorize formulas. You do need reliable tools and a consistent process.
A solid setup usually includes:
- An A/B test calculator for proportion-based tests like CTR and CVR
- A spreadsheet template for documenting baseline, MDE, power, significance, and stop rules
- Your analytics stack for pulling clean historical baselines
- Creative testing software that helps you generate enough structured variants to test real hypotheses
If you're comparing options for high-velocity experimentation, this roundup of the best creative testing platforms is a useful place to start.
The point isn't to become a statistician. It's to stop making creative decisions off unstable reads. Once you know how to calculate sample size and tie it to actual budget decisions, your testing gets slower in the right places and faster in the right places.
If your team needs more valid tests, not just more ads, Sovran is built for that workflow. It helps performance marketers produce large volumes of modular video variations for Meta, organize assets, and push more structured creative experiments into market without turning production into the bottleneck.

Manson Chen
Founder, Sovran
Related Articles

Storyboard Development: Scale Video Ad Production in 2026

8 Pattern Interrupt Techniques for Video Ads