How to Read Test Results: A Creative Data Guide
Jump to a section
- The Moment You Open Ads Manager After a Test
- The Metrics That Actually Matter
- Reading Significance, Sample Size, and Confidence
- Reading Multivariate and Hook-Body-CTA Outputs
- Spotting Winners vs Noise Over Time
- Common Mistakes When Reading Creative Results
- Turning Test Results Into Your Next Creative Sprint

You've just opened Meta Ads Manager after a creative test. Twenty variants are lined up, and every column tells a different story. One ad has the strongest CTR, another has the lowest CPA, a third leads on ROAS, and a fourth produced more purchases despite looking average at the click stage. Your standup starts soon, and “the one at the top” isn't a decision rule.
Learning how to read test results means separating signal from noise, then translating the result into a better next batch. For creative testing, that requires more than scanning CTR or accepting a platform badge. You need to connect the hook, body, CTA, audience, conversion path, and time trend.
The Moment You Open Ads Manager After a Test
The first instinct is usually to sort by ROAS and promote the top row. That feels rational because ROAS is closest to revenue, but it can hide a fragile result built on limited delivery, a narrow audience pocket, or an unusually strong day. The opposite mistake is just as common: sorting by CTR, choosing the ad that earns the most attention, and assuming the conversion problem belongs somewhere else.
The post-test screen is a decision problem, not a vibes call. Start by asking what the test was designed to learn. Was the purpose to identify a stronger opening hook, improve purchase efficiency, find a better offer explanation, or discover which CTA closes the gap? If the test has multiple creative elements, a row-level winner may only show that one particular combination happened to work together.

Modern creative testing platforms add another layer to native Ads Manager reporting. Instead of seeing only the final ad, you may see performance by hook, body, CTA, and combination, which creates a denser but more useful read. The right response isn't to find a single magic cell. It's to identify which components repeatedly contribute to efficient outcomes.
Practical rule: Never make the first decision from one column. Read the revenue metric, the cost metric, the conversion path, and the delivery context together.
A marketer learning ads on Facebook and Instagram for small businesses can apply the same discipline without a large testing operation. Export the results, label each creative element, and write one sentence explaining why a variant earned more or less budget. That sentence becomes the hypothesis for the next test.
The Metrics That Actually Matter
Read metrics in order of business consequence, not in the order Meta displays them. ROAS comes first because it connects spend to revenue, but it doesn't explain why the result happened or whether the economics are durable. Pair it with CAC, since a strong return can still conceal acquisition costs that the business can't support.
CVR isolates what happens after the click. A high CVR with weak CTR usually points to a credible offer or landing experience paired with an unconvincing hook. A high CTR with weak CVR suggests that the opening attracts attention without preparing the right audience for the next step. CTR is diagnostic, not automatically the goal.
CPM and impression share provide auction context. A higher CPM can reflect audience pressure or placement mix rather than poor creative, while low impression share may limit how confidently you compare variants. Treat both as explanatory fields, not verdicts.
| Metric | Tells You | Hides | Action Threshold |
|---|---|---|---|
| ROAS | Revenue efficiency | Volume, attribution quality, and stability | Investigate the leader, then verify cost and trend |
| CAC | Acquisition economics | Whether the creative earns enough qualified demand | Escalate when it approaches the business ceiling |
| CVR | Post-click persuasion and fit | Reach and auction conditions | Investigate meaningful variant gaps |
| CTR | Hook and initial message strength | Purchase intent and revenue | Use as a diagnostic signal |
| CPM | Auction cost and audience pressure | Creative profitability | Use for context only |
| Impression share | Delivery opportunity | Message quality | Check before judging limited-delivery variants |
A useful sanity check is whether CAC remains within the business's 2x ceiling, but that ceiling must come from your own unit economics, not a universal benchmark. Likewise, a 1.5% CTR floor may be a practical direct-response filter for one account and irrelevant for another. Treat these as operating rules only when they match your baseline, funnel, and margin.
A 15% CVR delta between variants is worth investigating when the sample supports comparison. It doesn't prove that the higher variant deserves scale, but it does justify examining its body, offer framing, landing-page alignment, and audience mix. For a deeper approach to cost efficiency, use this guide to reducing CAC as a companion to the creative read.
The best metric is the one that matches the decision. If you're choosing a hook, CTR and thumb-stop behavior help diagnose the opening. If you're choosing what to scale, CAC, purchase volume, ROAS, and stability carry more weight.
Reading Significance, Sample Size, and Confidence
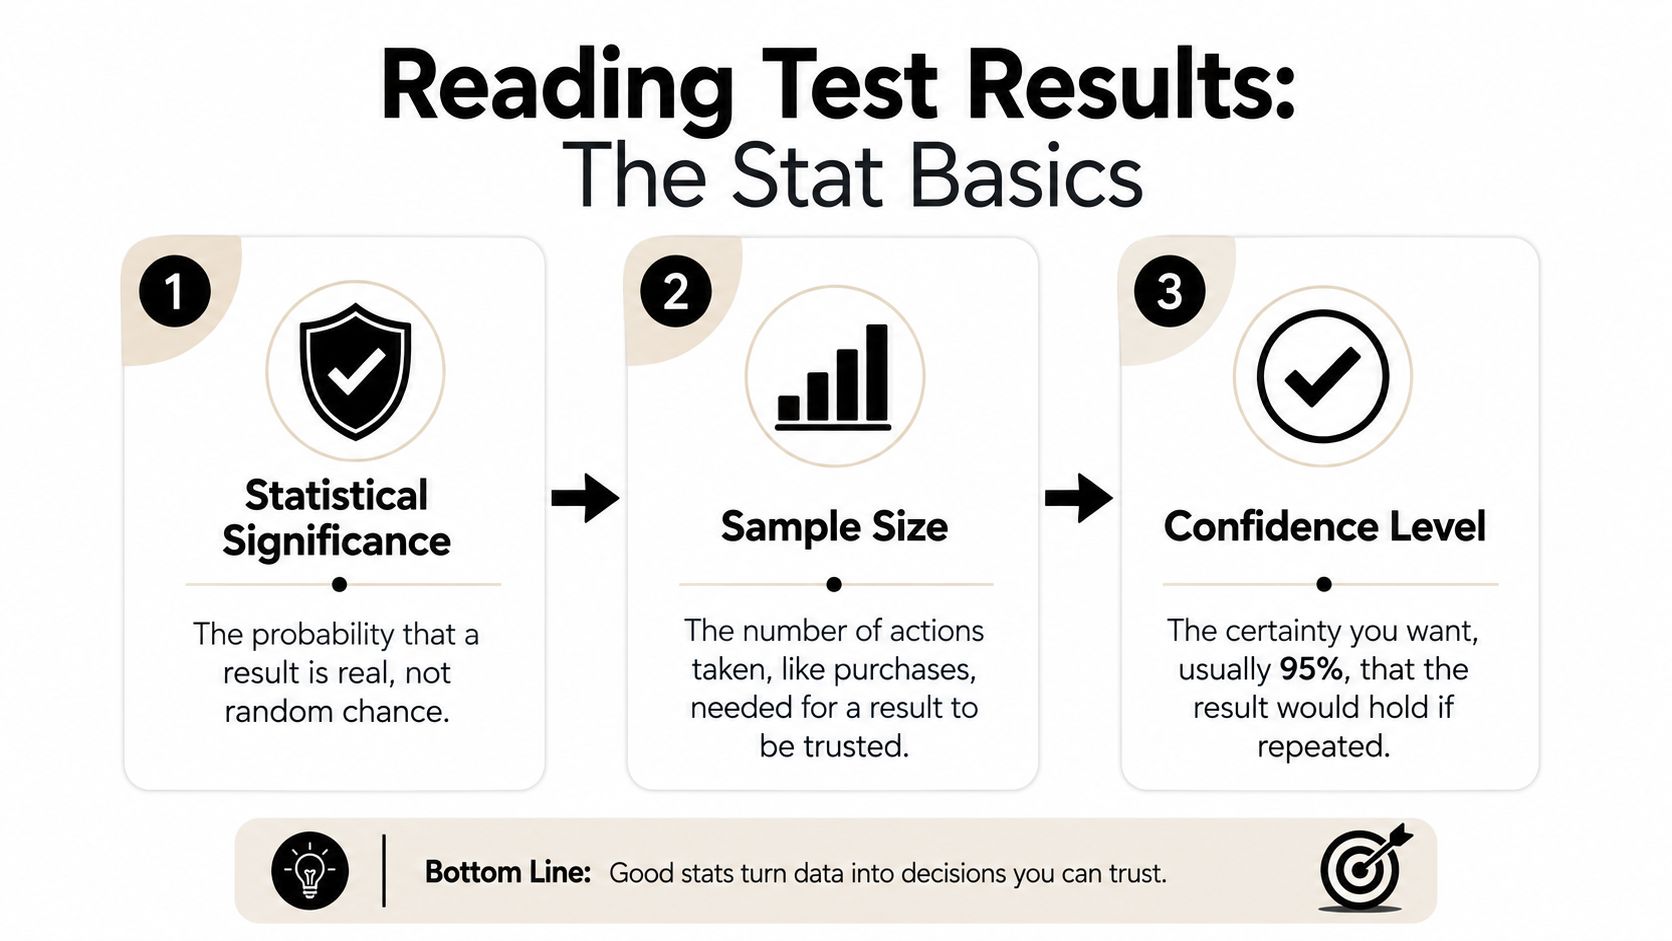
A result can be directionally promising without being reliable. Statistical significance asks whether the observed difference between variants is likely to be real rather than random variation. Sample size tells you how much evidence supports the comparison, while confidence level expresses how much uncertainty you're willing to tolerate.
A practical reading rule is to avoid calling a winner until each variant has accumulated enough action volume for the metric you're judging. For conversion metrics, that generally means at least a few hundred conversions per variant. For click-level analysis, it can mean a few thousand clicks. These are operating guidelines, not guarantees, and the required evidence depends on conversion rate, spend distribution, audience structure, and the number of comparisons.
Suppose Variant A reports a higher CVR than Variant B. Don't stop at the point estimates. Read the confidence interval around each estimate. If the intervals overlap heavily, the apparent lead may not be dependable. The same applies to ROAS. A visible gap in the dashboard can still represent a tie when uncertainty around both values is wide.
Meta's “winning ad” badge can help with navigation, but it shouldn't replace your own test read. Low-impression tests can produce an attractive early ranking before enough people have seen or acted on the ads. A multivariate reporting tool can add detail by showing per-cell p-values and lift estimates, which helps you distinguish a promising component from a lucky combination. Confidence interval analysis provides a useful framework for interpreting that uncertainty.
The result is not “significant” because the gap looks large. The gap earns trust when the evidence is sufficient and the uncertainty is acceptably narrow.
Before launch, record the planned sample size, primary metric, comparison set, and stop date. Don't change the stopping rule after seeing a favorable result. Pre-registration keeps the read honest and stops the team from repeatedly checking until noise happens to look like a win.
For a concise visual explanation of the statistical basics, this video can help reinforce the terminology:
Reading Multivariate and Hook-Body-CTA Outputs
A multivariate report should be read as a matrix, not as a list of isolated ads. If a platform combines three hooks, three bodies, and three CTAs, the important question isn't just which combination sits first. You want to know which elements perform consistently across combinations.
Start with the complete export. Preserve the variant ID, delivery fields, spend, impressions, clicks, conversions, CPA, and ROAS. Then rank every cell by the outcome that matters for the campaign. This first pass identifies candidates. It doesn't declare the winner.
Next, collapse the matrix by element. Calculate the average outcome for Hook A across its bodies and CTAs, then compare it with Hook B and Hook C. Repeat the process for the body and CTA. A component with the strongest stable average is more useful than a single top cell because it gives the creative team something reusable.
| Combination | Hook | Body | CTA | ROAS | Impressions | Status |
|---|---|---|---|---|---|---|
| A1 | Hook A | Body 1 | CTA 1 | Leading | Sufficient delivery | Candidate |
| A2 | Hook A | Body 2 | CTA 2 | Mixed | Sufficient delivery | Compare |
| B1 | Hook B | Body 1 | CTA 1 | Below leader | Sufficient delivery | Diagnostic |
| C3 | Hook C | Body 3 | CTA 3 | Promising | Limited delivery | Inconclusive |
Interactions matter. A modest hook can outperform a stronger opening when paired with a clearer body and a more relevant CTA. That doesn't mean the hook is useless. It means the elements influence one another, and the apparent winner may depend on the sequence.
Treat cells with fewer than 1,000 impressions as inconclusive, following the test rule established for this workflow. Don't use a thin cell to make a broad claim about a hook or CTA. Instead, carry it into the next sprint with a deliberate comparison.
A tool such as Sovran can support this workflow by recombining modular creative elements and identifying the specific hook, body, and CTA associated with reported performance. Its multivariate ad testing workflow is most useful when the team exports the full matrix and turns the output into hypotheses, rather than treating the top row as a finished answer.
The winning combinations are seeds. Keep the strongest components, change one meaningful variable, and test whether the pattern survives a new audience or offer context.
Spotting Winners vs Noise Over Time
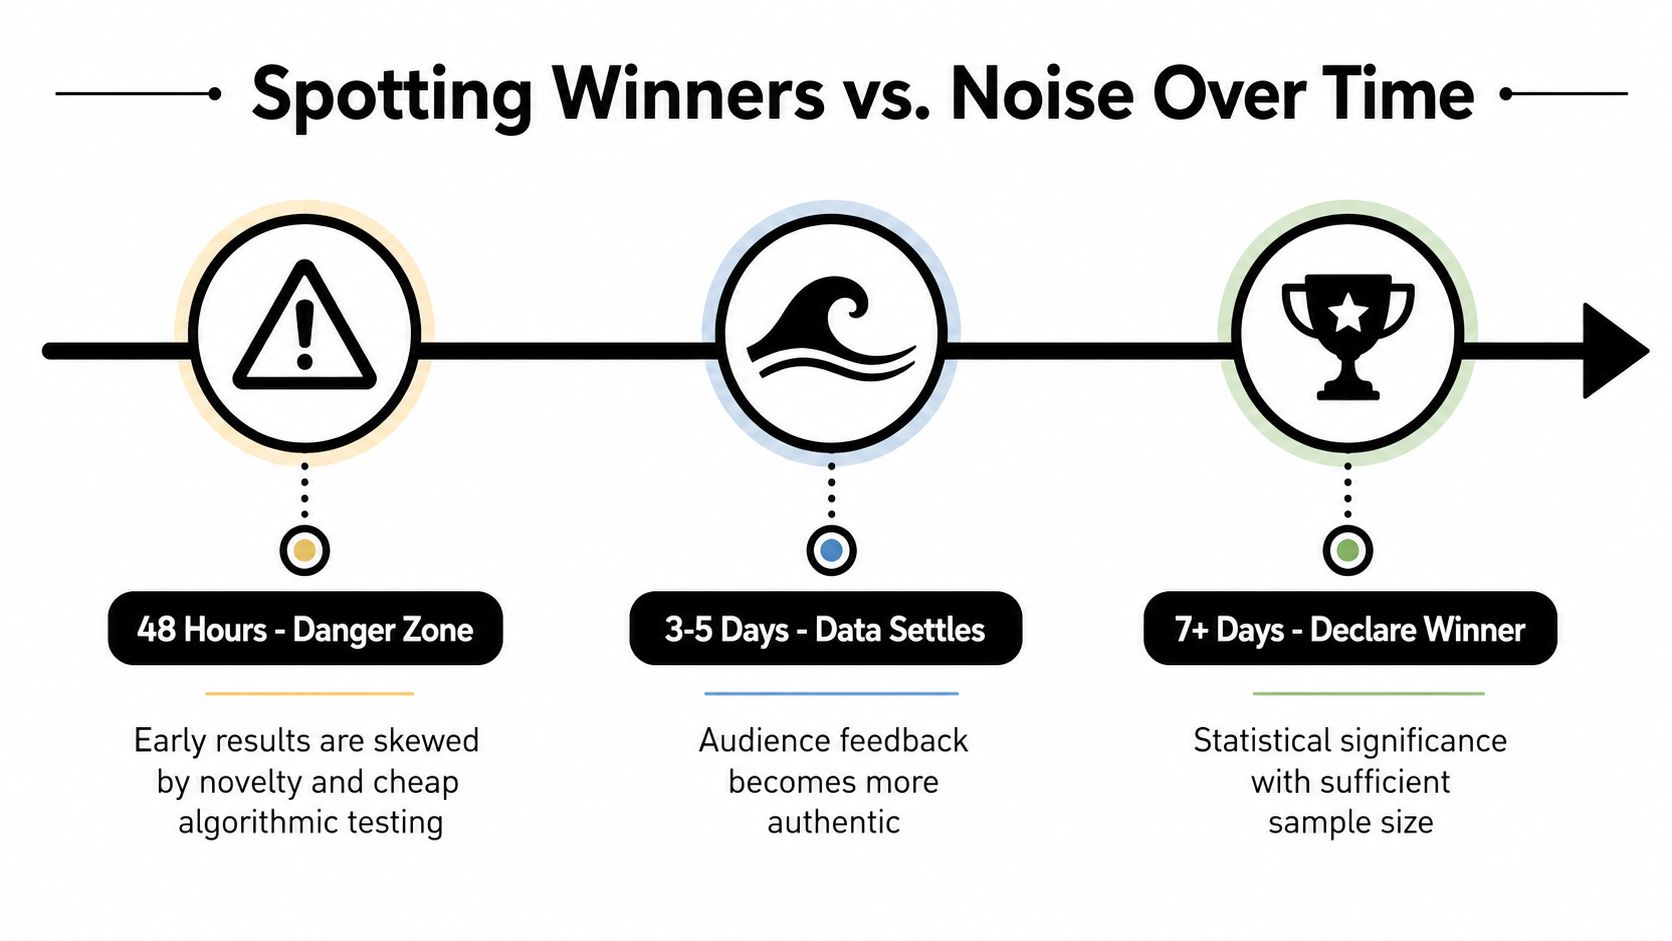
A creative that wins during its first two days hasn't necessarily won the test. Early delivery often favors novelty, and the first audience exposed to a new ad may be more responsive than the broader group Meta eventually reaches. That makes the 48-hour result a danger signal, not a final verdict.
Read the time series instead of relying on a cumulative headline. Plot daily CPA or ROAS for the leading variants and look for the shape of the performance. A durable winner holds its efficiency as delivery broadens. A novelty spike rises sharply and then decays as the system finds less immediately responsive users.
Read the audience before the average
Blended performance can hide a strong audience-specific result. Break the leading variants down by age, gender, placement, geography, device, and prospecting or retargeting status where the account has enough delivery to support the comparison. An ad that looks ordinary overall may be the right winner for one segment, while another variant may be carrying the average through a narrow pocket.
Frequency adds another warning signal. If frequency rises while CTR declines, the audience may be tiring of the message. That pattern calls for a fresh angle or refreshed execution, not automatic budget increases.
Use a time-based decision rule
The useful read usually arrives after the system has had time to normalize delivery. Review early data for obvious failures, inspect the middle period for stabilization, and make the final decision only when the trend, sample, and economics agree. This is also why planning the right number of ad variations matters. Too few variants limit learning, while too many can spread delivery so thin that no comparison becomes trustworthy.
A winner that needs one unusually cheap day to look good is not a scaling plan.
Keep a rolling view of the recent trend alongside the all-time result. The cumulative figure tells you what happened. The recent window tells you whether it's still happening.
Common Mistakes When Reading Creative Results
Most creative testing failures happen after launch. The marketer collects data correctly, then asks the wrong question of it.
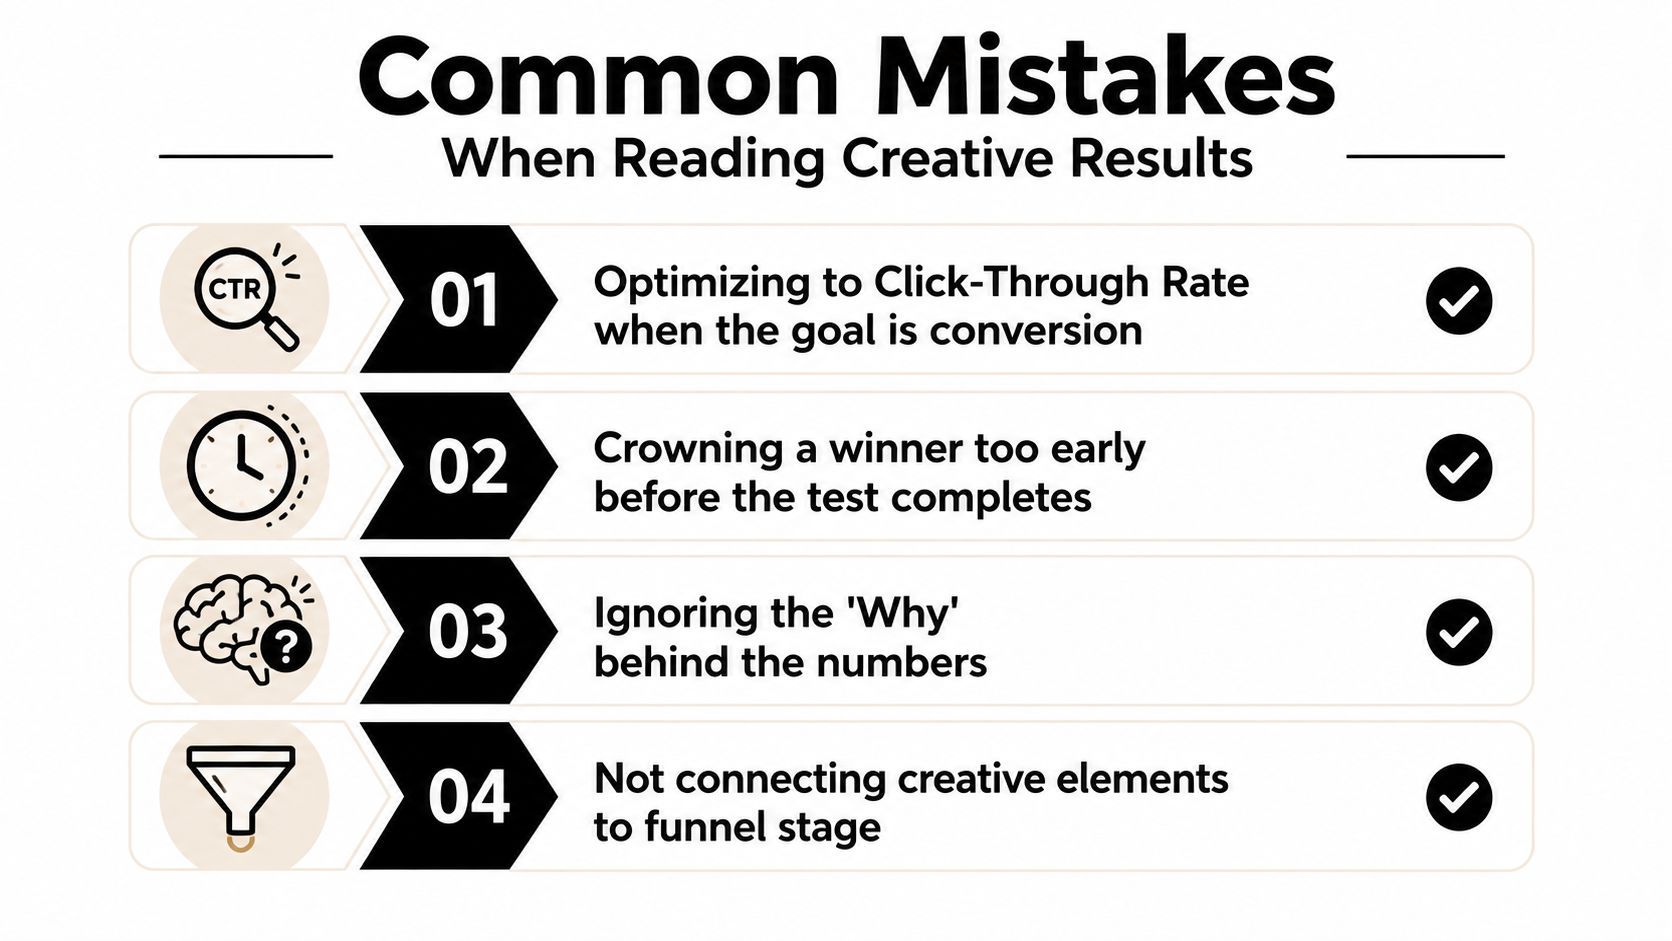
The first error is optimizing to CTR when the business needs purchases. A high click rate can coexist with weak conversion if the hook overpromises or attracts curiosity without intent. A lower CTR can still support better economics when the message pre-qualifies the right audience.
The second is favoring conversion volume over acquisition cost. More purchases don't automatically mean better performance if the ad requires disproportionately more spend. Read count and cost together, then check whether the resulting customers have acceptable value.
The third is treating a small ROAS gap as a meaningful lead. If the uncertainty around two results overlaps, the responsible label is often “tie” rather than “winner.” Use the tie to design the next test, not to manufacture certainty.
Other common reading errors include:
- Blending unlike delivery: Compare results within the ad set and audience structure Meta actually used. A blended account average can hide the mechanism behind delivery.
- Reacting to one bad day: Review the rolling trend before killing a variant. Daily volatility is normal in auction-based media.
- Ignoring fatigue: A creative can be statistically strong and commercially exhausted. Watch frequency, CTR direction, and conversion efficiency together.
- Confusing significance with value: A reliable lift isn't automatically worth scaling if the business impact is too small to justify production, review, and budget changes.
- Skipping the why: A winning row is less useful than a clear explanation of which promise, proof point, visual, or CTA helped the audience act.
The best post-test note contains both a decision and a reason. “Scale Variant 12” is incomplete. “Scale the proof-led body with the direct CTA, but retest the opening against two new hooks” gives the next team something it can execute.
Turning Test Results Into Your Next Creative Sprint
A test earns its budget only when it changes what you produce next. Close the reporting loop with a short operating checklist:
- Tag the components: Save the winning hook, body, CTA, audience, and variant ID in the creative library.
- Document the learning: Record the hypothesis, evidence, sample size, confidence read, and the audience where the pattern appeared.
- Promote carefully: Move confirmed winners into the appropriate scaling campaign, then hold the setup long enough to observe delivery rather than changing several variables at once.
- Archive with context: Keep underperformers and their IDs. Failed combinations can reveal weak promises, mismatched CTAs, or recurring visual patterns.
- Brief the next sprint: Make the strongest hooks starting points, not permanent formulas. Add controlled variations in body structure, proof, pacing, and CTA.
- Set a refresh trigger: Define the CTR, CVR, CPA, or ROAS trend that will prompt new production before fatigue becomes expensive.
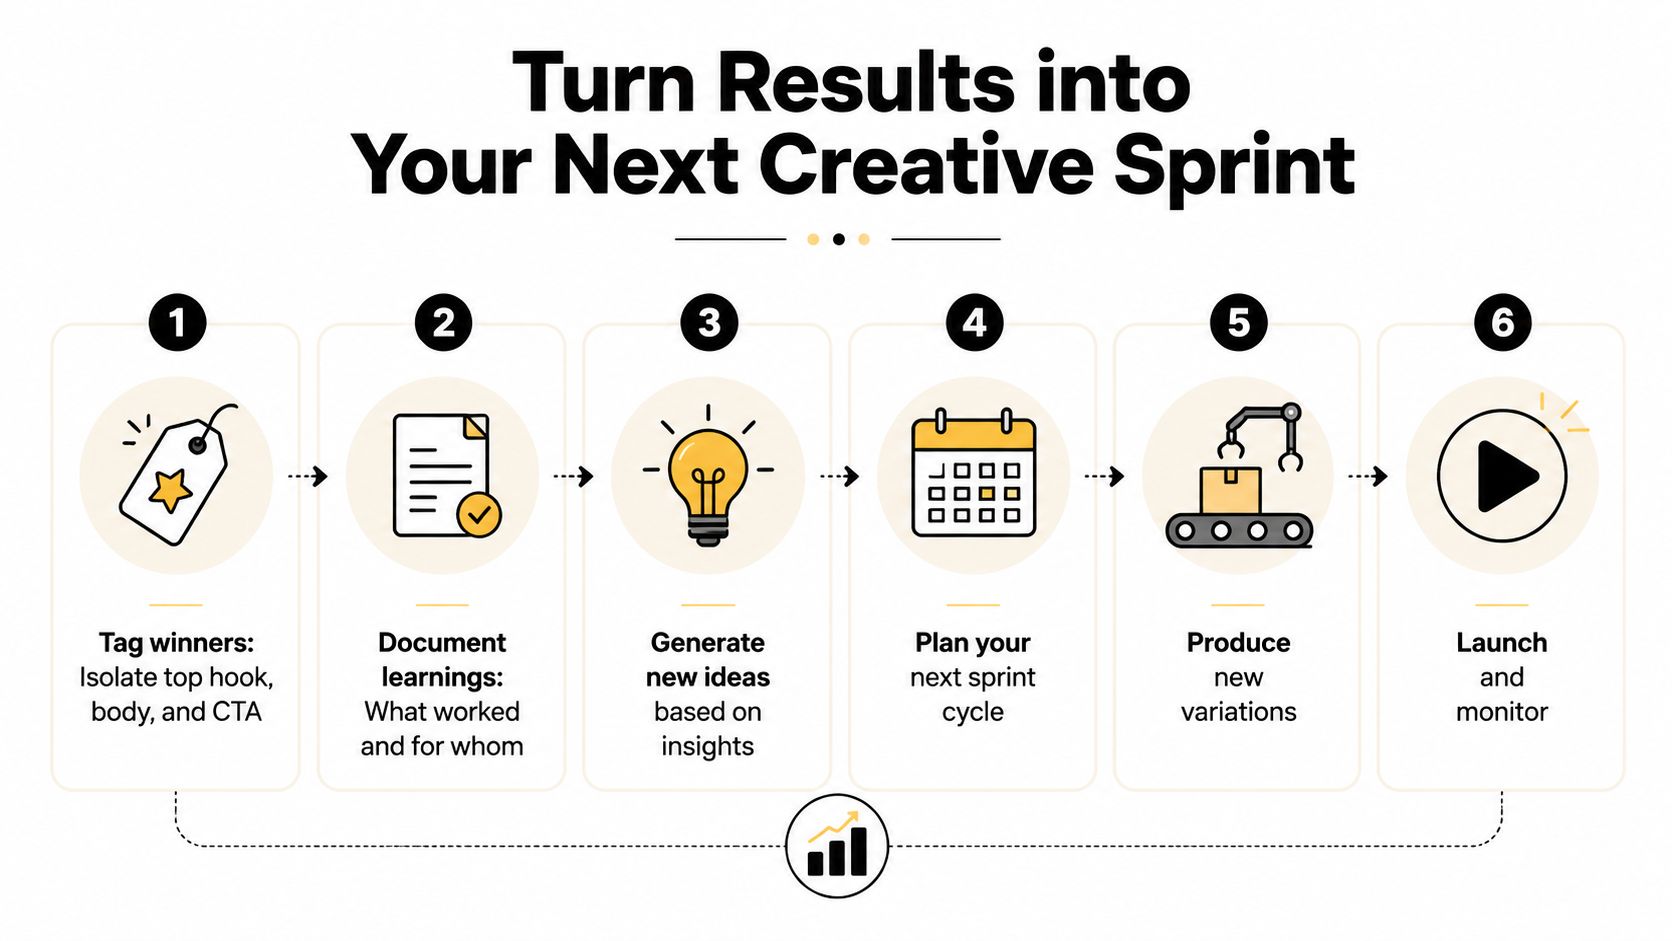
Use Meta Ads Manager for delivery, spend, audience, and conversion reporting. Use the creative testing layer for element-level interpretation and the decision log. A structured video ad iteration strategy helps turn each read into a repeatable production brief instead of a collection of screenshots.
The final discipline is simple: preserve the evidence, write the explanation, and launch the next test while the learning is still actionable. That's how a test becomes a compounding system rather than a one-time ranking.
Sovran helps performance teams organize modular creative testing around hooks, bodies, CTAs, and the decisions those combinations support. Visit Sovran to turn your next Meta creative read into a structured workflow for analysis, iteration, and launch.

Manson Chen
Founder, Sovran
Related Articles
Confidence Interval Analysis: Ad Testing Guide

Customer Journey Mapping for Performance Marketing