Understanding Statistical Significance for Ad Testing
Jump to a section
- When Two Ad Variants Tie and the Budget Has to Move
- The Core Concepts Behind Statistical Significance
- The Four Pitfalls That Sink Creative Tests
- Planning Sample Size Before You Spend a Dollar
- Bayesian Approaches and How to Read Them
- A Decision Checklist for Declaring a Winner
- Practical Takeaways and Frequently Asked Questions
You're in the middle of a campaign week, the dashboard is open, and two creative hooks are sitting close enough together that someone on the team wants a fast call. Hook B is ahead on CTR, the client wants momentum, and the budget spreadsheet is already open. That's usually where understanding statistical significance stops being an abstract stats topic and starts being a very practical money decision.
The hard part is that ad dashboards make small differences look decisive. A live test can show a winner-shaped result long before the data is strong enough to trust, and once budget moves, the cost of a bad call shows up in CPA, ROAS, and creative fatigue. The goal isn't to become a statistician, it's to know when a result is signal, when it's noise, and what to do next.
When Two Ad Variants Tie and the Budget Has to Move
A media buyer opens the test on Tuesday and sees hook B at 2.4% CTR and hook A at 2.1% CTR. The instinct is immediate, pause A, push budget to B, and let the winner run. That move feels clean because the gap is visible, but the visible gap is not the same thing as a reliable gap.
What usually gets missed is the amount of uncertainty still wrapped around those numbers. Four days into a test, with limited impressions per variant, the range of plausible outcomes is still wide enough that the apparent leader may not be better. A dashboard can make a small lead look like a verdict, even when the evidence is still soft.
That's why performance teams need a decision framework before they touch spend. If you've ever seen a test get declared too early and then flip the next day, you already know the pain. The rest of this article gives you the toolkit that prevents that mistake, from reading significance properly to planning sample size and knowing when a Bayesian read is a better fit. For a deeper look at how many ad variants to run at once, this guide on how many ad variations to test is a useful companion.
Practical rule: A small lead on a dashboard is only useful if the test has enough data behind it to make that lead hard to dismiss as chance.
The job on Monday morning is not finding the prettiest chart. It's deciding whether the test has earned the right to move budget.
The Core Concepts Behind Statistical Significance
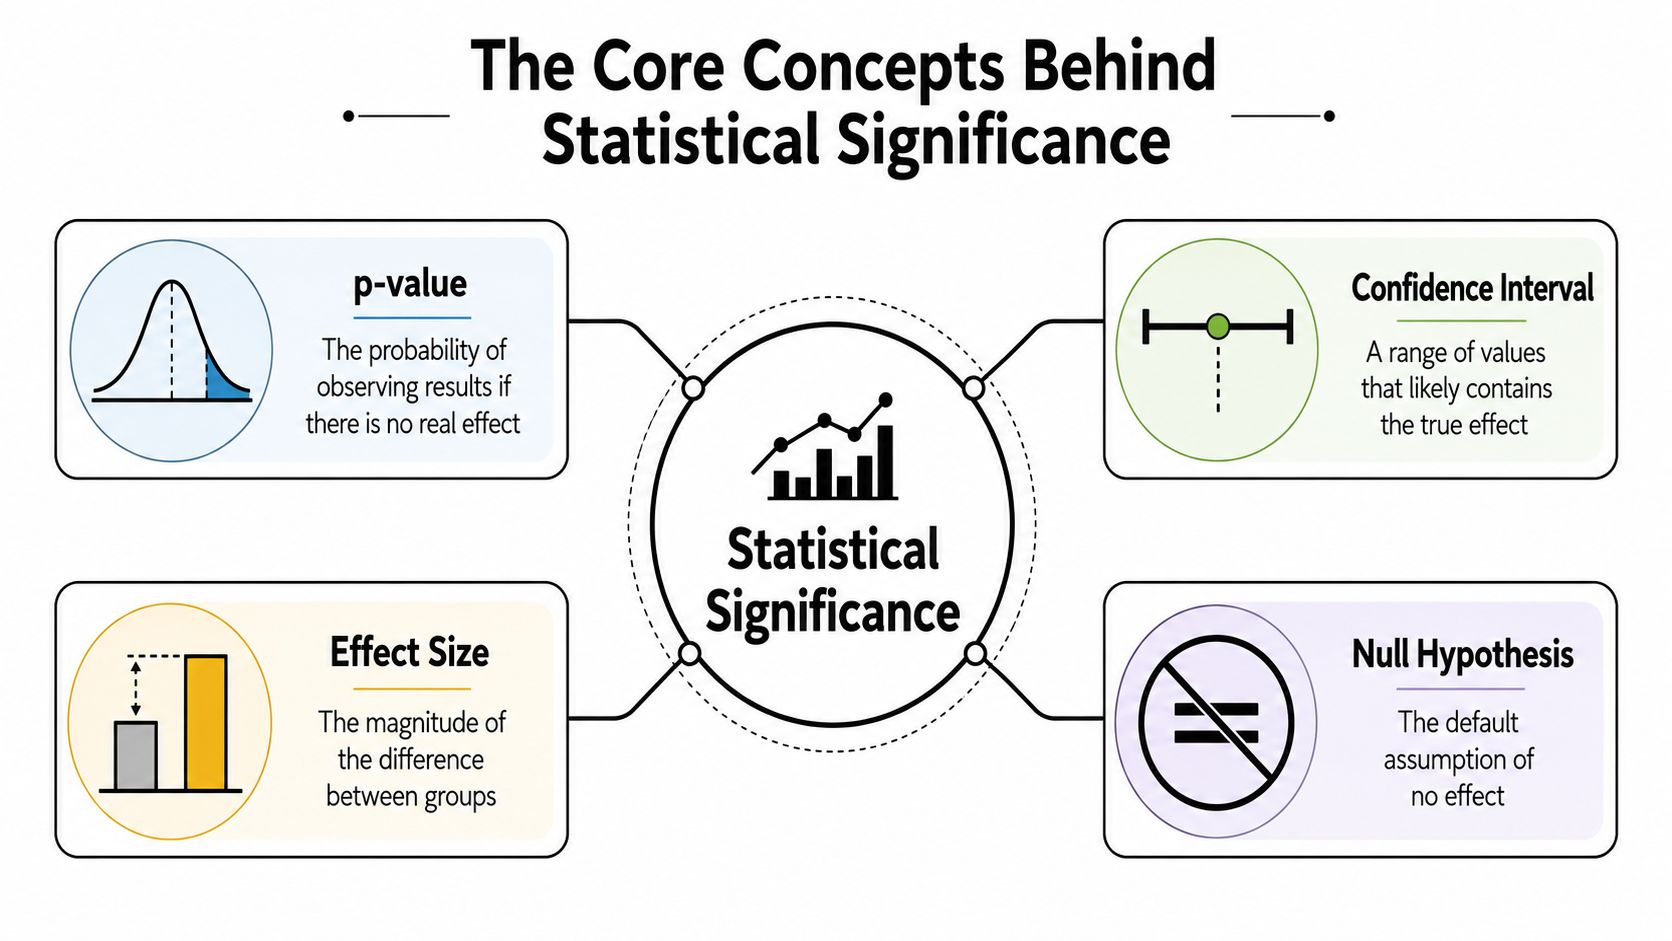
Start with the simplest meaning of the term. Statistical significance is a way of asking whether the difference you see between two ad variants is likely to be real, or whether it could easily have happened by chance if both variants were equal. In a hook A vs hook B test, the null hypothesis says there is no true difference, and the data has to do enough work to challenge that assumption.
Core definition: Statistical significance tells you how surprising your result would be if there were really no difference between the variants.
A p-value is the probability of seeing results at least this extreme, assuming the null hypothesis is true. It is not the probability that hook B is better, and it is not a direct measure of business value. In ad testing, a low p-value says the observed gap would be unusual if both hooks were really performing the same.
A confidence interval gives you a range of plausible values for the true effect. If hook B's CTR looks higher, the interval tells you how low or high that advantage might reasonably be once uncertainty is accounted for. A tight interval means more certainty, a wide interval means the test still leaves a lot unanswered.
Effect size is the magnitude of the difference itself. This is the part marketers often skip, because a result can be statistically significant and still too small to matter to the business. A lift that clears a threshold but doesn't change CAC, payback, or lead quality is a weak win, even if the math says it exists.
| Term | What it answers | Why a buyer should care |
|---|---|---|
| Statistical significance | Is the gap likely real, or could it be noise? | Helps you avoid false winners |
| P-value | How surprising is this result under no true difference? | Gives a formal test result |
| Confidence interval | What range of true lifts is plausible? | Shows how much uncertainty remains |
| Effect size | How big is the difference? | Tells you whether the win matters |
A useful habit is to read every “Variant B won at 95% confidence” report as a two-part question. How big is the lift, and how wide is the interval? If you don't ask both, you can end up celebrating precision without meaning.
The Four Pitfalls That Sink Creative Tests
The fastest way to misread a test is to treat significance like a green light instead of a measurement tool. In creative testing, the same four mistakes show up again and again, especially when teams are moving fast across Meta and TikTok.
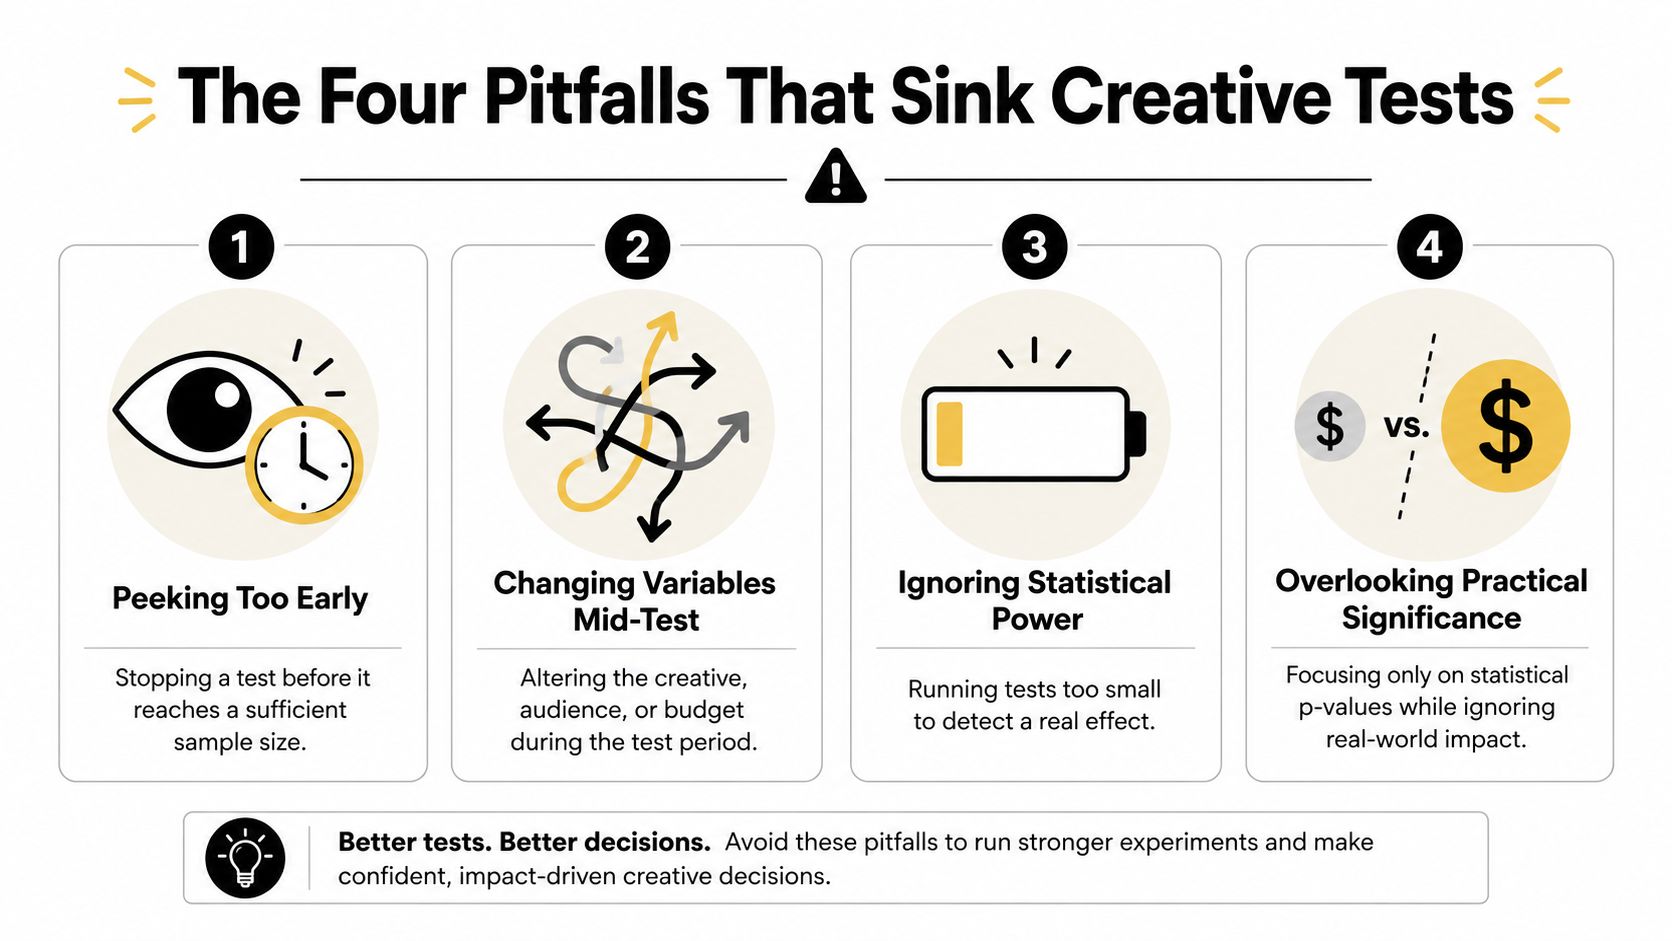
Peeking too early
A buyer checks the numbers every few hours, sees one variant pull ahead, and stops the test early. The problem is that early reads are the noisiest reads, and the apparent winner often cools off once the sample grows. If you keep asking the test the same question before it's mature, you train yourself to trust volatility.
Changing variables mid-test
Creative gets swapped, the audience gets broadened, or budget gets rebalanced while the test is still live. That breaks the comparison because you no longer have the same test from start to finish. If the setup changes, the result is no longer a clean read on the original hypothesis.
Ignoring statistical power
A test that is too small can't reliably detect the lift you care about. In that case, a “no difference” result doesn't mean the variants are equal, it means the test may not have been equipped to see the gap. This is especially painful in multivariate cells, where many recombined hooks, bodies, and CTAs compete for a thin slice of traffic.
Overlooking practical significance
A result can be statistically valid and still commercially irrelevant. If the lift is tiny, the business may not feel it, even if the math is satisfied. That's why buyers should always ask whether the win would change budget allocation, not just whether it clears a threshold.
Diagnostic question: If the test had ended yesterday, would you still trust the same winner tomorrow?
For a broader field guide to common ad-testing missteps, the article on five mistakes brands and agencies make in Facebook ads covers several of the same failure modes in a platform-specific way.
The fix is not more enthusiasm, it's better test discipline. Lock the setup, decide how much data you need before launch, and treat every result as a measurement problem first and a creative judgment second.
Planning Sample Size Before You Spend a Dollar
The most useful habit in performance testing is deciding the required sample before the campaign goes live. If you wait until the end to ask whether you had enough traffic, you've already made the biggest planning mistake in the process. The right starting point is simple, baseline rate, minimum detectable effect, desired power, and significance level.
Here's the logic in plain language. Your baseline rate is the current CTR or conversion rate you expect from the control. Your minimum detectable effect is the smallest lift you care about. Power is the chance your test will catch that lift if it's real, and the significance level is the threshold you're using to control false positives.
A common proportion test frame looks like this:
n per group ≈ 2 × (Zα/2 + Zβ)^2 × p(1-p) / δ^2
You don't need to memorize the algebra, but you do need to know what drives the number. Lower baseline rates, smaller lifts, and stricter confidence all make the required sample go up. That's why teams often discover too late that the lift they want is too fine-grained for the traffic they have.
For a worked walkthrough of the setup and formulas, this guide on how to calculate sample size is a useful reference.
| Minimum Detectable Effect | Relative Lift | Required Impressions per Variant | Estimated Test Duration at $500/day |
|---|---|---|---|
| Smaller lift | Tighter target | Higher sample need | Longer run time |
| Moderate lift | Practical target | Lower sample need | Shorter run time |
| Larger lift | More aggressive target | Lowest sample need | Shortest run time |
The table is the part that usually changes how teams think. A tighter MDE sounds disciplined, but in practice it can stretch a test far beyond the budget or pacing window you have. A looser MDE can make the test workable, but only if the lift would still matter commercially.
For Meta and TikTok campaigns, the cleanest move is to plan the sample before launch, then decide whether the test duration fits your spend rate and creative calendar. If the answer is no, either widen the MDE, accept lower power with that caveat documented, or save the hypothesis for a higher-volume window.
Bayesian Approaches and How to Read Them
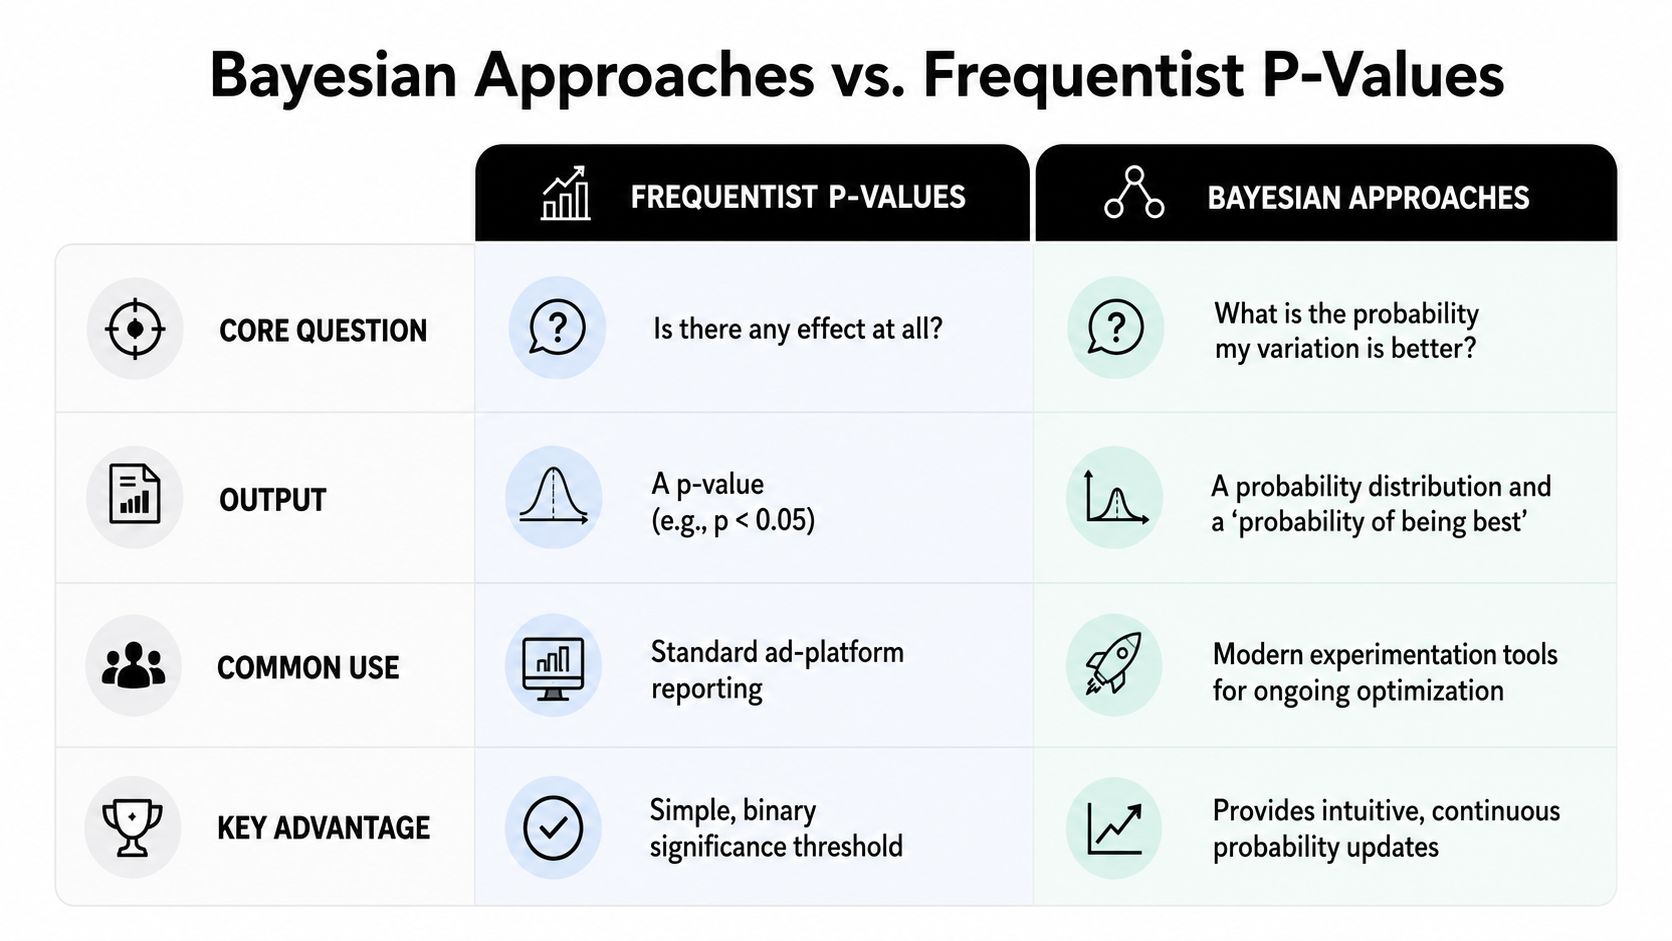
Frequentist and Bayesian analysis answer different questions, and that's why buyers keep confusing them. The frequentist frame asks whether the observed result would be unusual if there were no true difference. The Bayesian frame asks how likely each variant is to be the better choice, given the data so far.
That difference matters in fast-moving creative workflows. If you're running a constant stream of hook-body-CTA recombinations, you often care less about a single binary verdict and more about which variant deserves the next round of spend. Bayesian outputs are usually easier to read in that setting because they give you a probability distribution instead of a hard cutoff.
The trade-off is that Bayesian results depend on the prior you choose, so the setup matters. They also make it tempting to peek constantly, which can be useful when you want continuous updates, but dangerous if you keep changing your mind before enough evidence accumulates. Frequentist methods are still a better fit for larger tests where you've already defined an MDE and want a cleaner decision threshold.
| Frame | Best question to ask | Typical output | Good fit |
|---|---|---|---|
| Frequentist | Is there evidence of a real difference? | p-value, confidence interval | Larger planned tests |
| Bayesian | Which variant is most likely to be best? | Probability distributions, credible intervals | Fast iteration cycles |
If you want to see how a modern creative workflow can support this kind of decisioning, the ai fashion studio example from WearView is a useful illustration of how modular production can feed ongoing experimentation.
Sovran fits naturally into that same workflow because its multivariate testing setup is built around recombining creative assets and pushing them into ad platforms. The multivariate ad testing tool overview shows how that kind of system supports rapid iteration when the question is which version to keep shipping.
A Decision Checklist for Declaring a Winner
A winner call should survive four checks, not one. First, the test needs to have reached the planned sample size, or at least a point where it had a fair shot at detecting the MDE you care about. If not, the clean move is to keep it running or mark it as exploratory instead of pretending it settled the question.
Second, the lift has to matter to the business. A result can be statistically valid and still too small to justify a budget shift, especially when media costs, creative fatigue, or downstream conversion quality are in play. Third, the confidence interval needs to be narrow enough that the worst plausible outcome still looks acceptable.
Fourth, if you ran more than two variants, you need to think about multiple comparisons. A multivariate cell with many recombined creative options creates more chances for false positives, so the more cuts you make, the more careful the read has to be.
Decision rule: If the result is significant but not useful, don't crown it. Use it to refine the next hypothesis.
That's also the right lens for negative results. A properly powered test that shows no meaningful difference is not a failure, it's a useful answer that lets you retire the angle and move budget to the next idea. If you need a framework for tying this to spend decisions, the article on optimize your marketing budget connects testing discipline to allocation choices in a practical way.
For a closer look at how reporting shapes the final call, the creative tests in Facebook ads reporting guide is a helpful companion.
Practical Takeaways and Frequently Asked Questions
The short version is simple. Plan sample size before launch. Choose MDE based on what would change spend. Correct for multiple comparisons in any multivariate cell. Don't call a winner on the first significant day, and use Bayesian framing when you're iterating quickly across lots of small variants.
How does creative fatigue change the math?
It shortens the useful life of a test because performance can drift as audiences burn through the same angle. That means a “winner” may stop being a winner if you wait too long, so the timing of the decision matters as much as the threshold.
Should you rerun a failed test?
Yes, but only if the first run was underpowered, noisy, or confounded. If the test was properly powered and still showed no meaningful difference, rerunning the same angle usually wastes traffic.
What if the platform says one thing and a third-party calculator says another?
Check the assumptions first. Differences often come from the way each tool handles sample size, variance, or the test design itself, so the disagreement is usually about inputs, not magic.
How do you explain a non-significant result to a stakeholder?
Say the test didn't produce strong enough evidence to call a winner, and show the confidence interval or Bayesian probability range if you have it. That keeps the conversation on decision quality instead of forcing a fake conclusion.
If you want a testing workflow that helps your team build, launch, and evaluate modular creative more cleanly, visit Sovran and see how it supports multivariate ad testing for Meta and TikTok teams that need faster reads without sloppy budget calls.

Manson Chen
Founder, Sovran
Related Articles
How to Read Test Results: A Creative Data Guide
Confidence Interval Analysis: Ad Testing Guide