How to Measure Your Creative Tests in Facebook Ads Reporting
IntroductionIf you're running creative tests at scale, you already know how tough it is to keep track of what’s working. It’s easy to get lost in all the data,...
Jump to a section
Introduction
If you're running creative tests at scale, you already know how tough it is to keep track of what’s working. It’s easy to get lost in all the data, trying to figure out which ads or creative ideas are driving results. Without a good system, you might be wasting money on ads that aren't doing the job.
In this blog, I’m going to show you how to monitor your creative tests using Facebook’s ad reporting tool. We’ll cover how to set up your dashboard, the key metrics to watch, and some handy tricks to keep your ad testing process smooth. By the end, you’ll know exactly how to tell which ads are worth keeping and which ones should be paused.
Why You Need a Dashboard for Creative Testing
If you’re doing any sort of creative testing, you need a clear way to visualize the results. Whether it's different ads, concepts, or creative elements like hooks and visuals, a dashboard helps you quickly spot what’s working and what isn’t. Without this, you’re just guessing. A good dashboard helps you see patterns and makes it easy to adjust your strategies.
Using Facebook Ad Reporting for Creative Testing
Overview of Facebook's Ad Reporting Tool
I prefer using Facebook’s ad reporting tool to track creative performance. It’s powerful, free, and flexible. You can pull data from the same sources as other paid tools like Motion, but Facebook’s interface gives you more options to customize your views. With the right setup, it’s easy to monitor what creative variations are working in real-time.
Setting Up Your Ad Columns for Testing
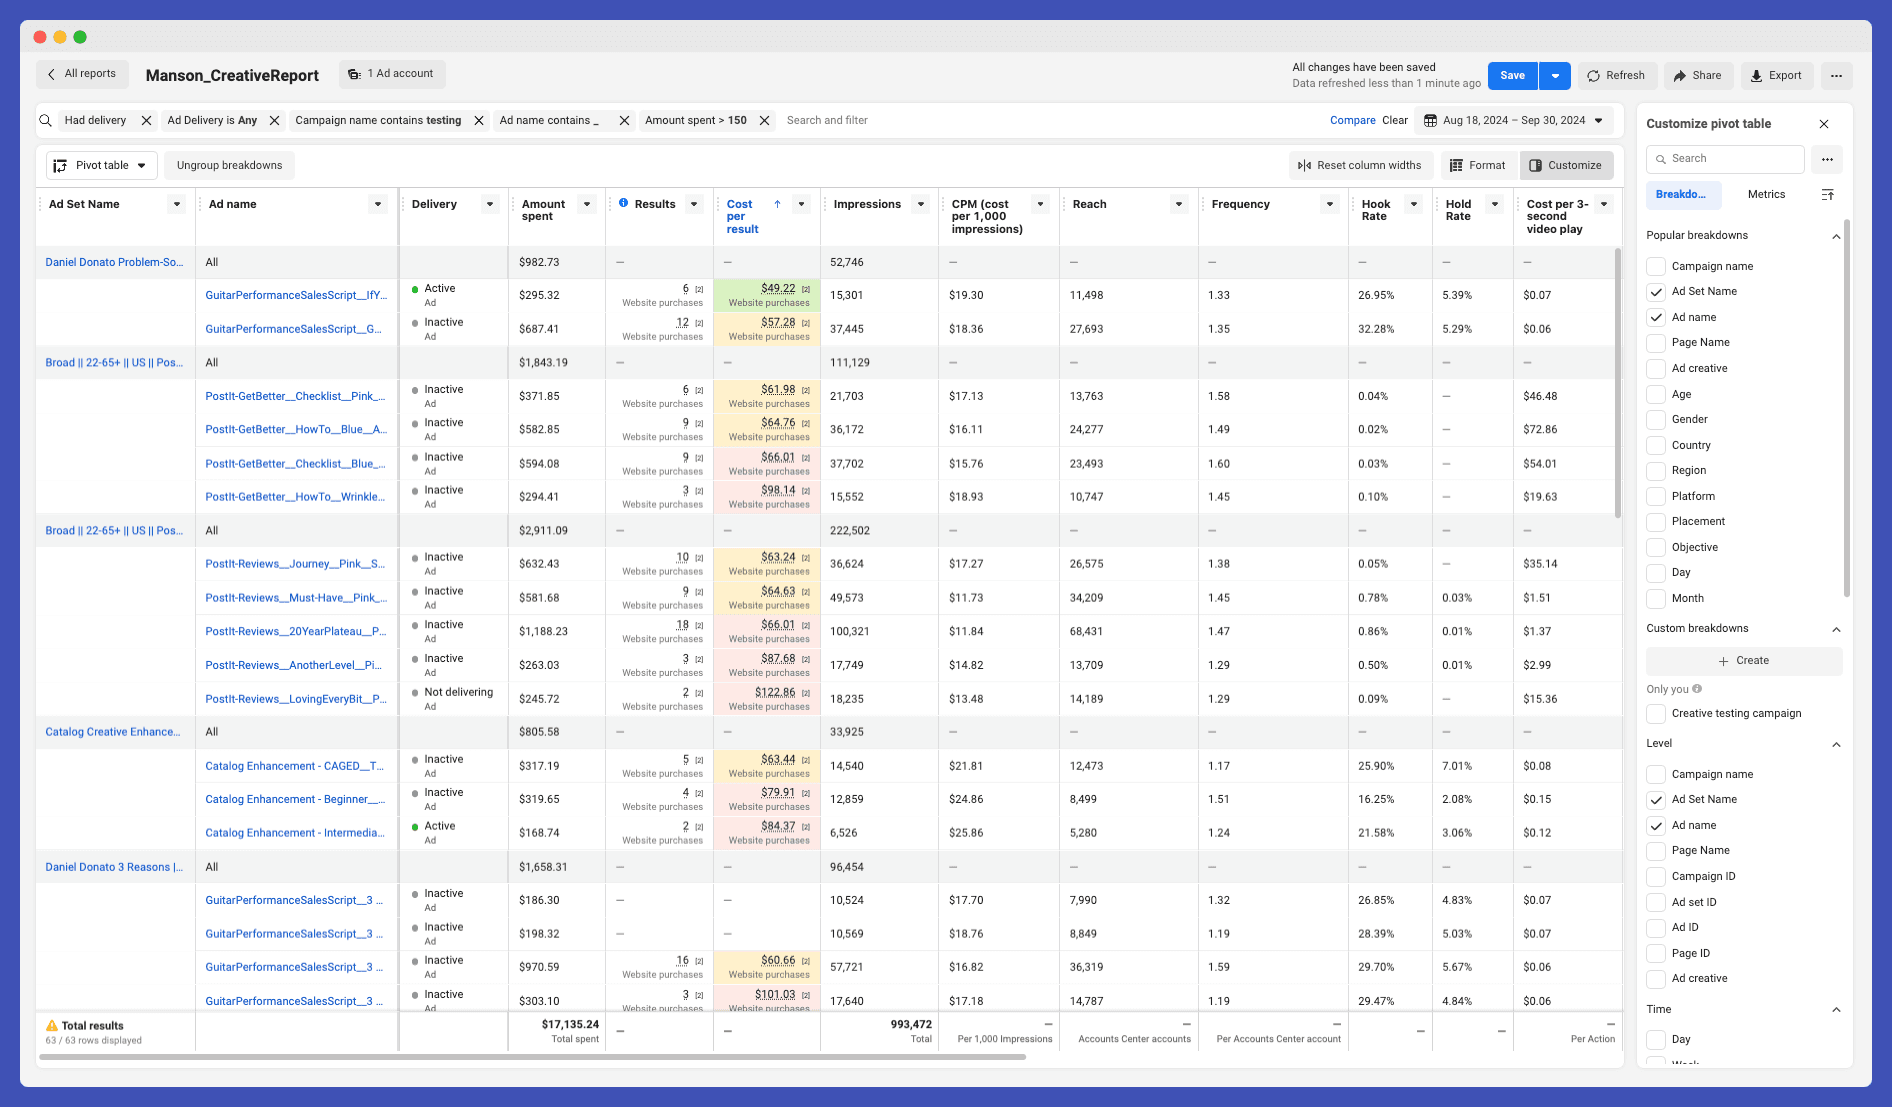
Here’s how I set up my ad report for creative testing:
Ad Set Name: I group all variations of a creative concept under one ad set. This helps me see which overall concepts are performing well.
Ad Name: Each ad variation has a unique name, and I track performance at this level.
Delivery: I look at whether the ad is active or not.
Amount Spent: This column shows how much we’ve spent on each ad so far.
Purchases: This tracks the number of purchases or conversions from the ad.
Cost per Purchase: One of the most critical metrics, showing how much each purchase costs.
I like to use conditional formatting rules to quickly spot ads that are performing well. This works just like Excel or Google Sheets, where you can use colors to highlight data that meets certain conditions.
Important Metrics for Monitoring Creative Performance
Here are some of the key metrics I monitor to understand how well my creative is doing:
Hook Rate: This is the percentage of people who watched the first 3 seconds of your video. It’s calculated by dividing 3-second views by impressions. A high hook rate shows your ad is grabbing attention.
Hold Rate: This is the percentage of people who watched at least 15 seconds of your video. It’s a good indicator of how engaging your content is.
Other Metrics: I also track things like cost per 3-second view, average view duration, link click-through rate (CTR), and the overall result rate (purchases or other conversions).
These soft metrics give you insight into how your audience is reacting to the creative, even if they don’t directly translate into purchases.
Organizing Creative Testing Campaigns
If you’re spending more than $50,000 a month on ads, I highly recommend setting up a separate creative testing campaign. Facebook often spends the majority of an ad set’s budget on one ad, even when that ad might not be the best performer. By isolating your tests, you can ensure you’re getting reliable data without Facebook’s algorithm prematurely favoring one variation.
Setting Automated Triggers for Efficient Testing
Testing creative ads can get expensive if you don’t set clear cut-off points. That’s where automated triggers come in. I set up three "gates" that ads have to pass through:
First Gate: After spending $150 with zero conversions, the ad gets paused. This is based on a 3x CPA (Cost Per Acquisition), and it helps keep costs down.
Second Gate: If an ad has spent $300 but has a high CPA (above $75-80), it gets cut.
Third Gate: Any ad that spends more than $500 and has a CPA over $65 also gets paused.
These gates let me test more ads while staying on budget. If an ad doesn’t meet these standards, I know it’s not worth keeping in the rotation.
Conditional Formatting for Better Visualization
To make things even clearer, I use conditional formatting on key metrics. For example, if the cost per purchase is less than $65 after spending $150, that ad is considered "good enough" to move to the next phase. I’ll then duplicate that ad into our winning campaigns, which run worldwide.
With the right formatting rules, you can quickly see which ads are winners and which need to be paused.
Tracking Creative Win Rate
Another important metric to keep an eye on is your creative win rate. This tells you how many of your creative variations are actually performing well. I calculate it by dividing the number of winning ads by the total number of ads tested.
For example, in one of my recent tests, I tested 47 different ad variations in a little over a month. Out of those, only 6 ads hit our CPA goal. That’s a win rate of around 12-13%, which is actually a bit higher than average. Most accounts see about a 10% win rate, though it can be lower depending on the scale of your testing.
Conclusion
Monitoring creative testing doesn’t have to be complicated, but it does need to be organized. By using Facebook’s ad reporting tool, setting up clear metrics, and putting automated triggers in place, you can easily spot what’s working and cut what isn’t.
I recommend giving Facebook’s ad reporting tool a try for your creative testing. It’s flexible, free, and with the right setup, it’ll help you save time and money while improving your ad performance.
If you’re not tracking your creative win rate, start now! You’ll gain valuable insights into what’s driving results and be able to fine-tune your creative strategy for even better performance.

Manson Chen
Founder, Sovran
Related Articles
How to Scale Facebook Ads: A Guide to Profitable Growth
Trying to scale Facebook ads by just cranking up the budget is a classic rookie mistake. It's a surefire way to watch your ROAS tank. Real, sustainable scaling...

10 High-Impact Marketing Video Examples for Your 2026 Strategy
In performance marketing, scrolling is the enemy. On platforms like Meta and TikTok, you have less than three seconds to stop a potential customer from swiping...
A Guide to Facebook Automated Ads That Drive Real Results
So, what exactly are Facebook's Automated Ads? Think of them as Meta's AI-powered system designed to take the guesswork out of running campaigns. It automates...